Monday, July 15, 2013

Using BCS to report on Raiser's Edge information in SharePoint - Part I

Following up on our earlier post of Some Possibilities to Display Raiser's Edge data in SharePoint, I am going to turn my attention to the Business Connectivity Services (BCS) functionality.  BCS, formerly known as the Business Data Catalog, is intended to provide "out-of-the-box" integration capabilities with other data sources. This integration provides external data in a SharePoint list, with it looking and acting like a SharePoint list, even though the data continues to "live" in the external database.  Once this data is consumed in SharePoint, the end-user gets the benefit of SharePoint views, column sorting, filtering, plus much more.

The integration also means view, edit, add, and delete capabilities on these non-SharePoint datasources (think of SQL Server databases).  The Raiser's Edge runs as a SQL Server database, thus we can grab this information and leverage BCS to provide that information to our end-users.  This same concept can be applied to any other SQL Server database, but we will focus on The Raiser's Edge for this post.
Raiser's Edge Proposals shown in SharePoint via BCS

At first blush some may say, wow, that is pretty awesome.  Others, myself included, may become very wary of all of those capabilities.  For instance, I have found that most COTS solutions that leverage SQL Server have a highly normalized database with many relationships, or foreign keys, throughout the database tables.  So to pull information from the source database into a format that is consumable and makes sense to the end-user, views may need to be created that join these many tables to get at the actual values that are important (a text value instead of numeric ID for example).  When you think in these terms, the "View" capabilities are much more powerful than the Create, Update, and Delete (from CRUD).  I know there will be instances, probably in more homegrown databases designed to work with the SharePoint BCS, where all CRUD capabilities can be pretty powerful.

With all that being said, lets take the BCS for a spin to pull Raiser's Edge Proposal data into SharePoint so we can provide that information to our wider business community.  The first thing we need to do is to create a view in SQL Server to select the proposals from The Raiser's Edge. The Proposal table in the Raiser's Edge has lots of foreign keys (or references to other reference data or code table data) and alone is insufficient.  By creating a view in SQL Server we can join the Proposal table to these other tables (Tableentries, Campaigns, etc.) to display the textual values for these columns.


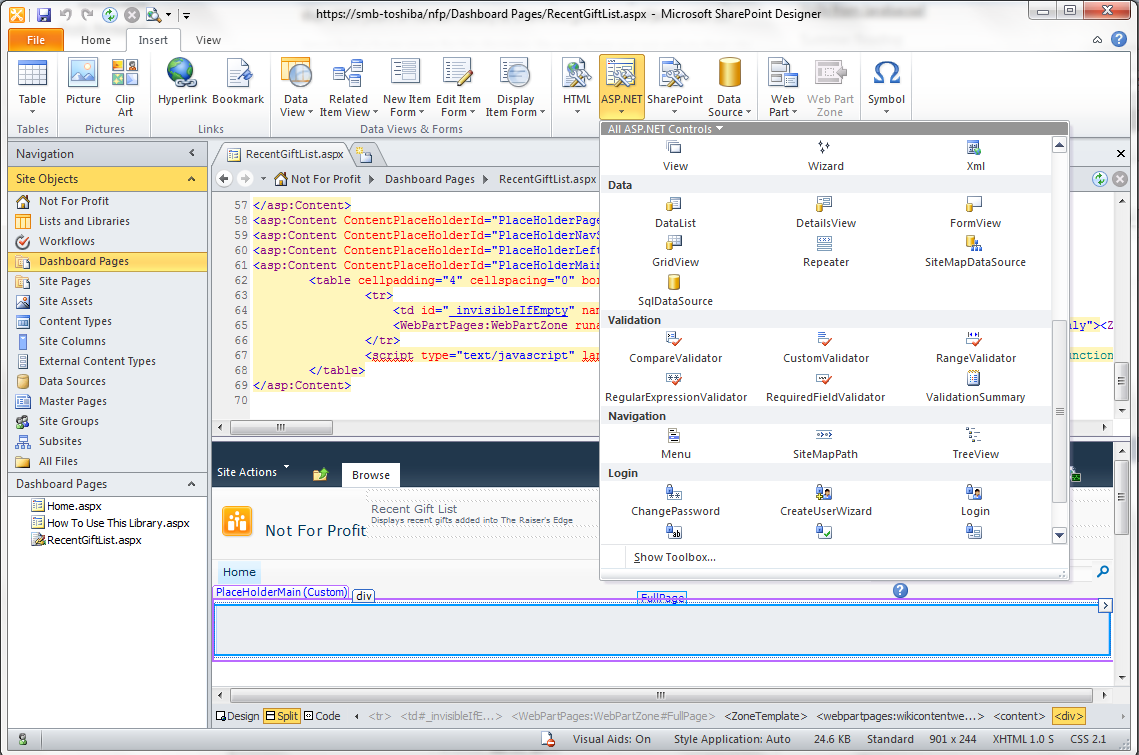
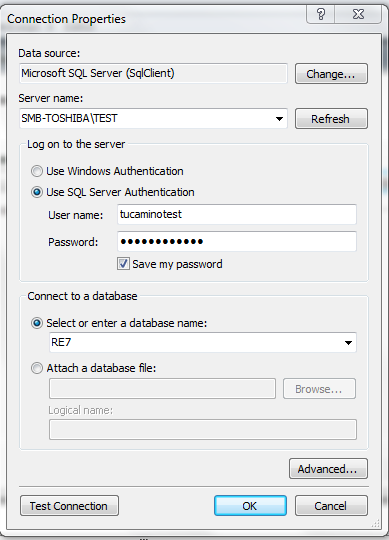
After setting up the view in SQL Server, we can open up SharePoint Designer to perform the next series of tasks.  External data is exposed via External Content Types in SharePoint.  We created a new external content type and named it REProposal.  After the initial creation (as seen below) we have a base external content type from which to expose this Raiser's Edge proposal information in SharePoint.  We still need to do some configuration of this external content type.


Now that we have the external content type defined, we need to configure the connection to the SQL Server Raiser's Edge database.  There are multiple connection types for the external content type, but I have chosen the SQL Server.  This connection type allows for the extraction of information directly from the SQL Server database.  After establishing the connection, we then have the Raiser's Edge tables and views, as seen at the right, available for selection.

Because I created the view that exposes the Raiser's Edge proposal information in the format that I want, I navigate to the view I created by expanding the Views folder.  When we find our view, we right-click on the view to see which operations we can then include in our external content type.  As I mentioned previously, we could have full CRUD capabilities but I believe this is not appropriate,  at least for what we are trying to accomplish today.  We need to select two operations: Read Item Operation and Read List Operation.  Read List provides the capabilities to pull the entire dataset and Read Item exposes an individual item in the list for view (such as an item dialog form to see the item's details).  These operations are seen at the left.  There are some further configurations that need to take place with the columns.

Now we have the external content type created, we must create a List with this external content type.  This option is available in the Ribbon of the external content type in SharePoint Designer.
Once the list is created, lets navigate to the list in SharePoint.  So I open Internet Explorer and navigate to the URL that the list should have been created at.  Uh-Oh.  Take a look at the right:  I must have forgot something, I am getting an "Access Denied" message when I was expecting the list of Raiser's Edge proposals. 

I forgot to set the permissions on the external content type in SharePoint Central Administration.  I forgot to navigate to the Application Management, BCS service application management section to set the permissions, as seen below on the external content type I created.


Now after setting the permissions, I am able to navigate to the list in SharePoint and I have my list of Raiser's Edge proposals.  I can now use this list as if it were a SharePoint list, even though the data itself resides in the Raiser's Edge SQL Server database.  I can create custom, filtered views, add a web part to a web page with a specific view of the RE Proposals, or do any number of things with the list of proposals, as if we were managing it in SharePoint.  This type of functionality can be created on many types of datasources, including other SQL Server databases.  Coming soon, another post that then takes this external list of data to show how it behaves like a normal SharePoint list.  Contact me at Tucamino Solutions if you need help leveraging this kind of functionality at your organization or want to find out how else we can help you.


Friday, June 21, 2013

Displaying a Raiser's Edge Gift List in a SharePoint page with an ASP.NET Web Part

In an earlier post I wrote about some of the possible ways Raiser's Edge data could be reported or displayed using SharePoint, allowing other people in your organization to access these reports, dashboards, and lists without having to log into The Raiser's Edge.  Today we are going to focus on one of those ways:  using the available ASP.NET web controls or web parts in SharePoint Designer.

In this post I am going to focus on creating a simple recent gift list displayed on a SharePoint web page.  As mentioned in the previous post, there are many ways to go about this.  For those developers that know how to use the ASP.NET web parts, a quick and easy way to accomplish this is to drop one of the available web parts onto a Web Part Page, connect the web part to the Raiser's Edge database, write the SQL statement, and format the web part - pretty simple!!
The first step is creating a new web part page.  We need a place that we want to display the gifts and the natural location is to create a Web Part Page in a library that is on the site.  You may want to create your own library for pages, or use the built-in Site Pages library.  It is really up to you.  In addition a Wiki Page may present problems, thus we recommend that you create a Web Part Page.  When creating the page we selected a layout that was one column as we are only going to have one web part on the page and we want as much real estate hortizontally as possible to add as many columns as we might want.

After creating the page, I open up the site with SharePoint Designer, check out the web part page, and open the page in design mode.  When in this mode you can add SharePoint web parts as well as other web parts.  As mentioned above, we are going to use an ASP.NET web part (some of these are pictured at the left).  We are going to choose the GridView for its tabular or grid format, simple rendering of the data in a list format, and easy styling the control to make it a bit more professional.
After placing the GridView web part on the page, we need to tell the web part how to connect to The Raiser's Edge database.  To do this we create a new data connection.  When setting up this connection, you will be presented a similar dialog form to many of the sql tools and utilities in the marketplace.  Because The Raiser's Edge is a SQL Server database, we select this option then enter the appropriate details to connect to the database.  I recommend that you have your administrator create a new SQL Login and provide it the appropriate privileges (read-only to protect the integrity of the data).  Note, this SQL Login is not the same as the "new user" created in The Raiser's Edge application, but a SQL Login created via the SQL Server Management Studio.   We entered the SQL Server instance where the RE database resides, the SQL Login user name and password, along with the Raiser's Edge database.  I recommend that you also click the "Test Connetion" button to ensure that the connection details you have entered work!

 
Now that we have the connection details defined, we need to write the SQL to pull our gifts.  As many of you may know, writing a SQL statement to pull information from The Raiser's Edge may not be a simple SQL.  I tried to display enough information to keep it interesting but not go too overboard.  I also chose to pull just cash gifts as well (see the WHERE G.TYPE IN (1,2,3,31) at the left).  We could write a function to be included in the SQL to show the gift type and allow all gift types to be displayed, but this shows how we can really get at specific information in our reports.

After writing the SQL we then have a Grid View that displays a rough outline of how the grid is going to look.  I chose an out of the box "Professional" style which applied the formatting to the headers, columns and rows.  You could really spend a lot of time customizing the look and feel of the GridView and the individual elements, but for our exercise I thought keeping it simple was the best approach.

Now that we have the SQL written, a connection to the database configured, and the web part styled, it is just a matter of checking in the web part page and opening the SharePoint site to see how it looks and making any edits we might need to.  Below is the outcome of our little project: a web part page that displays recent gifts sorted by the gift date, with the most recent at the top.  Someone that wants to see this information doesn't have to log into The Raiser's Edge or ask someone for the "report", they can just go to the web page to see the information.  Obviously you can extend this type of functionality to dashboards, other reports, adding filtering and search criteria to make it truly dynamic and powerful, even create a mini RE application (having one page that shows constituent information about a specific constituent, another for a campaign, etc. and connecting via links embedded on the pages - now that would be fun).  And the best of all is someone doesn't have to log into The Raiser's Edge to get this information; they can get it on-demand, and it looks professional.


If you would like to explore this type of functionality or run an idea by us, please go to our website to see what else we can do for you or send us a contact us request.  I would even love to hear what other ideas you would like for me to explore on this blog that you think could be powerful, especially if it pertains to The Raiser's Edge or SharePoint.   Also, I want to say thanks for checking out my blog.  If you have any feedback, don't hesitate to reach out to me via this blog or the website referenced above.

Thursday, June 20, 2013

Some Interesting Possibilities Displaying Raiser's Edge Reports and Dashboards in SharePoint

So you have invested in Microsoft SharePoint and you are trying to figure out how you can get the most bang for your buck.  Your organization also has purchased and implemented The Raiser's Edge.  You may be feeling that the reports in The Raiser's Edge are lacking, or that you don't have enough licenses to allow everyone in your organization to connect to The Raiser's Edge at the same time.  Perhaps you don't want to have to train all your end-users, especially those that only need reports anyway, on how to use The Raiser's Edge.

Well, you can leverage the SharePoint platform to display information from The Raiser's Edge via web pages.  It could be dashboards and other reports, lists of data, or even detailed information about your constituents, events, or other records in RE.  Imagine if you have users that need only read-only access: being able to have a web page in SharePoint where the user can enter filter or search criteria and view those constituents that meet the criteria along with details about those constituents, all without having to log into The Raiser's Edge.

Below are some of the ways that SharePoint can be leveraged to display this RE information, or any other information from any SQL database or other data sources:

ASP.NET Web Parts
Many ASP.NET web parts, such as the Grid View and Data List, available with SharePoint Designer, allow us to query and display data from different data sources in many types of formats, typically in a table or form layout. They can work with any data source that’s available in SharePoint Designer, like SQL Server, XML files, and more.  And with The Raiser's Edge being SQL-Server based, these web parts can be used to display this data. Another advantage is that it is easy to customize and considered "out-of-the-box"  and a "no-code" solution.  Check out this blog post where I use an ASP.NET to show a recent gift list from The Raiser's Edge.

Business Connectivity Services
The Business Connectivity Services allows SharePoint to connect to other systems, such as The Raiser's Edge, you already have, and work with them in various ways. A developer can configure the data connections to connect to The Raiser's Edge and import data into external content types, which can then be viewed in a SharePoint list.  What is great is this capability is native to SharePoint 2010 and 2013, however it can be a bit awkward at times, depending on what you might want to do.  In addition, it is meant to allow for data interaction (adding, editing, etc.) and not only for the consumption of data.  With The Raiser's Edge being a complex relational database model, it is advised that this feature not be utilized to update Raiser's Edge data, but to only view data.  Our first entry to show how BCS might be used is posted at the following link.

Excel Services
Excel Services provides the capability to display a named item from a Microsoft Excel workbook, such as a named range or chart, as a web part in a SharePoint web page.  This allows end users to build reports in Microsoft Excel and with developer assistance, display these for others to view as components in a web page.  A developer could even automate the creation of the Excel reports, the publication of the Excel workbook to SharePoint, and WHAM, all the reports are automagically updated.

SQL Server Reporting Services
SQL Server Reporting Services provides a full range of ready-to-use tools and services to help you create, deploy, and manage reports for your organization, as well as programming features that enable you to extend and customize your reporting functionality.  With Reporting Services, you can create interactive, tabular, graphical, or free-form reports from relational, multidimensional, or XML-based data sources. Reports can include rich data visualization, including charts, maps, and sparklines. You can publish reports, schedule report processing, or access reports on-demand. You can select from a variety of viewing formats, export reports to other applications such as Microsoft Excel, and subscribe to published reports. The reports that you create can be viewed over a Web-based connection or as part of a Microsoft Windows application or SharePoint site. You can also create data alerts on reports published to a SharePoint site and receive email messages when report data changes.

Visual Studio Custom Web Part
Visual Studio can be a powerful medium for creating components that can hook into SharePoint or The Raiser's Edge.  A custom web part that gives the developer more control over the visual presentation can be created with this development platform.  For example, a developer could create a visual web part that displays a chart based on some data from The Raiser's Edge.  This chart could be created by hooking into Google Charts to render the visual presentation of the chart.  I hope to create an example of this to show the power.  Parameters and Properties could be added to the web part to give further implemention options.  For examnple, one web part could allow the person deploying the web part on one page to display a pie chart for each Campaign, but on another the same web part could display the chart per Fund.  All in all, this is the most customizable option to creating that perfect set of web parts.

There are more options but these are a few of the highlights of possible ways to deploy Raiser's Edge reports and dashboards to SharePoint.  I hope to post an example for each of these in the coming months to give you detailed examples.  This type of reporting can be used for many other databases as well.  Contact us via email or go to our website to let us know how we can help you improve the way you work with The Raiser's Edge or Sharepoint.

Monday, June 17, 2013

The Raiser's Edge Financial Dashboard Part V - How to Extend It Further

OK, so we have picked apart the Tucamino Solutions Raiser's Edge Financial Dashboard application a bit.  Great, so what.  Well, you may download it and give it a try and say to yourself "This is the best reporting application ever for The Raiser's Edge!!!".  OK, probably not, but you may say "you know what, this is actually pretty cool and it shows great information, but I wish it could _____________".  Thats OK.  No application, report, or dashboard is perfect. 

What we have provided is a foundation for an application that can be used out of the box and provide great information.  However, it is also designed in a way that it can be extended very easily.  What do you mean by "extending" it further?  Well, that simply means that we have a core platform or baseline to add new functionality.  Here are some ways to add new functionality:

1.  Change the actual dashboard components.  Perhaps you want to look at Raiser's Edge gift trends over 5 years, or want to show a chart based on a Constituent's or Gift's constituent code. 
2.  Add new drill-down reports.  You may need additional detailed reports that we can add for you to drill-down into more detailed. Perhaps it deals with Pledges or Recurring Gifts, or even Proposals and Actions.
3.  Add filtering and other configuration options.  As mentioned in the posts, this dashboard component only focuses on cash gifts (cash, pay-cash, etc.), but perhaps you want stocks and gift-in-kind included.  In addition, maybe you want each user that uses the application to be able to filter based on other data (constituency, solicitors, etc.).
4.  Create a whole new application.  You may have a need for something completely different but want it in a similar format, displaying completely different information, or anything else you might think of.  Because we have a starting point, and we know The Raiser's Edge, we can quickly develop applications that you can use, minimizing the total cost to you because we have a head-start.

We offer discounts on customizing this application as we want to not only provide specific updates and new functionality for paying customers, but where we see the opportunity, we will include that new functionality in our FREE product for others to use.  We can't keep adding this functionality without your help.  We want to keep this product free for all.  So it is a win for the entire non-profit community when you use us for your Raiser's Edge customizations and other technology-related efforts.

Go check out our website to see what else we can do for you and even see what other products we might have.  At the very least go to our site and request your FREE download of our Raiser's Edge Financial Dashboard product and give it a spin and provide us some feedback.

Check out the other articles, coming soon, in our series:
The Raiser's Edge Financial Dashboard Part I - The Overview
The Raiser's Edge Financial Dashboard Part II - The Big Picture
The Raiser's Edge Financial Dashboard Part III - Drill-Down Analysis
The Raiser's Edge Financial Dashboard Part IV - True Integration with The Raiser's Edge

Tuesday, June 11, 2013

The Raiser's Edge Financial Dashboard Part IV - True Integration with The Raiser's Edge

Welcome back.  We are in our fourth blog post in the series on the Raiser's Edge Financial Dashboard.  We have looked at some of the specifics of the dashboard application, form the high-level home page, or "Big Picture" to the drill-down capabilities to get more information.  We touched on briefly in our last post about the capabilities to truly integrate with The Raiser's Edge.   Integration can mean many different things to different people.  What I mean by "true integration" with The Raiser's Edge is hooking into the Raiser's Edge API, commonly called the RE:API.

The Raiser's Edge Financial Dashboard is designed in a way that the user can connect via the RE:API, and get access to the built-in Raiser's Edge forms, etc. or the user can connect directly to the SQL Server database.  In order to take advantage of the integration as described in this post, the option to use the RE:API must be selected (as seen at the right).  A benefit to not selecting this option, and using the "Connect directly to the SQL Server database" option, is that a Raiser's Edge concurrent license is not used and thus other users can access The Raiser's via the RE application while other people are accessing and using the Raiser's Edge Financial Dashboard application.  A quick  disclaimer: those organizations hosted by Blackbaud will likely not be able to take advantage of this type of Raiser's Edge customization due to constraints with using Blackbaud hosting.  This will affect nearly all customized products that integrate with The Raiser's Edge as well.   

When the Raiser's Edge API option is selected, and the user clicks on the Raiser's Edge Financial Dashboard to launch the application, immediately the user begins to see how integration with the RE:API takes place.  They are presented with the standard login screens provided by the out-of-the-box RE application.  First there is the option to select the database to connect to and second is the username and password login form for that database selected, as seen at the left.  A user may only open the dashboard application and view the dashboards and reports when they have successfully authenticated with that database, all via the RE:API.

After successful login to The Raiser's Edge, the main dashboard page, as described in a previous posts comes up.  On the main dashboard page additionally functionality such as the drill-down capability to other reports and dashboards, as well as access to Raiser's Edge information shown in Raiser's Edge forms is available from the right-click menu on the dashboard components.  At the right is an example:  The FY Campaign Year-To-Date component allows a user to hover over a section of the chart for a specific campaign and then select to open the campaign with the out-of-the-box Raiser's Edge Campaign form.

After selecting to open the campaign from the right-click menu on the Campaign dashboard component, the out-of-the-box Raiser's Edge campaign form opens.  As seen at the left, this is the campaign form that a user sees when a campaign is opened from the Raiser's Edge application.  How cool is that?  Well, I think it is pretty powerful considering the user is not in The Raiser's Edge, but in another application.  The user can navigate this form just as they would normally, accessing other reports and links from this campaign record.


The tight integration to The Raiser's Edge does not stop at the main dashboard page.  When a user drills down into the dashboard application, eventually a user may look at a list of gifts.  This list contains some of the details for the gifts such as Gift Amount, Gift Date, Campaign(s), etc.  When one considers this specific set of information, opportunties arise for further integration with The Raiser's Edge.   As seen at the right, when the user right-clicks on a gift they may then open the gift or the constituent which gave the gift.  You could even have campaigns available, solicitors, or other links to detailed information in The Raiser's Edge.

When the user clicks on the "Open constituent <Constituent Name>" link, more magic happens.  The user is presented with the constituent form used in The Raiser's Edge application.  For those users of The Raiser's Edge, they know that the constituent form contains a wealth of information (much more than what is aggregated and summarized in the Financial Dashboard).  And when one considers that this type of functionality can be included in an application that resides outside of The Raiser's Edge, well, I would hope they would say "That is pretty cool stuff".  Now think about the possibilities of connecting The Raiser's Edge data to other data sources but providing this powerful linking capability.  The possibilities are endless.

If you want to get more information about the Tucamino Solution's Raiser's Edge Financial Dashboard application, go to the product page on our website.  You can find more products listed on our website as well..  You can request a download of the product, and many more, from our website.

Check out the other posts in our series at:
The Raiser's Edge Financial Dashboard Part I - The Overview
The Raiser's Edge Financial Dashboard Part II - The Big Picture
The Raiser's Edge Financial Dashboard Part III - Drill-Down Analysis
The Raiser's Edge Financial Dashboard Part IV - True Integration with The Raiser's Edge
The Raiser's Edge Financial Dashboard Part V - How to Extend It Further


Wednesday, June 5, 2013

The Raiser's Edge Financial Dashboard Part III - Drill-Down Analysis

In our last post about the "Big Picture" on the Raiser's Edge Financial Dashboard we looked at the details on the main dashboard.  However, the dashboard and reporting application also has more than the one dashboard.  In this episode we will look at the drill-down capabilites of the application.

After the Tucamino Solutions Raiser's Edge Financial Dashboard opens, displaying the Main Dashboard with the charts, graphs, and data tables, the user can drill-down to get at more detail with most of the dashboard components. 

At the right is the first example.  When reviewing the 12 Month Period Comparison, the end-user may want to get more detail for a specific period.  When the user right-clicks with their mouse on a specific cell or header in the grid, they are presented with a menu of options.  As shown at the right, the end-user can view a list of gifts for the specific time period or a summary dashboard for that time period.

The Gift List, shown at the left, is an example of a drill-down report available in the Raiser's Edge Financial Dashboard. It provides a list of gifts for the end-user to view.  Most dashboard components with the dashboard application allow drill-down to a list of gifts.  This can be for a specific campaign, fund, time period, or other specific filters.  This drill-down report also provides summary statistics at the bottom of the report.  These gifts can be sorted by clicking on the column headers.


Once on the gift list report, there is further drill-down capabilities into data for the Raiser's Edge dashboard.  When the user right-clicks on a gift row, a menu is presented that allows the user to go to the gift or the constituent the gift is recorded under.  What is cool about this is that these menu options will open the forms from The Raiser's Edge, giving the end-user access to built-in Raiser's Edge functionality.  These forms will only be accessible when the user selects to sign-in to The Raiser's Edge via the RE:API module.  When SQL Server authentication is chosen, these menu options are not available. There is a benefit to each authentication method, such as not using an expensive RE concurrent license when chosing the SQL Server authentication.

As seen at the left, drill-down capabilities are available on the charts and graphs in the dashboard as well. For example, the user can drill down into a campaign and see the campaign details in the default Raiser's Edge campaign form via the RE:API integration.  In addition, further dashboards and reports are available via the other menu options, including the previously discussed gift list option.  If you like what the dashboard presents but want further drill-down capabilities, we can customize that and add these additional drill-down features.
One of the options for the drill-down capabilities for campaigns is to see an Active Campaign Summary dashboard.  This report and dashboard shows various summary statistics including how much has been raised, what % that is of the total goal, how much is expected due (pledge installments recorded in RE), and how much of the goal is forecasted, or committed (when adding total raised plus total expected from pledge installments).
In addition, there is a visual breakdown of how much has been raised per month over the last 12 months to see which ones may be trending in a positive or negative direction.

This post begins to highlight the power of a dashboard application.  Drill-down reports and dashboards can be created to give more detail and potentially give more information targeted at a specific role or individual to allow them to be more productive in their responsibilities.  In addition, we get an introduction to the integration possibilities with the RE:API and the custom dashboard application by being able to bring up campaigns, funds, constituents, and gifts in the out-of-the-box Raiser's Edge application-based forms.

If you want to get more information about the Tucamino Solution's Raiser's Edge Financial Dashboard application, go to the product page on our website.  You can find more products listed on our website as well..  You can request a download of the product, and many more, from our website.

Check out the other posts in our series at:
The Raiser's Edge Financial Dashboard Part I - The Overview
The Raiser's Edge Financial Dashboard Part II - The Big Picture
The Raiser's Edge Financial Dashboard Part III - Drill-Down Analysis
The Raiser's Edge Financial Dashboard Part IV - True Integration with The Raiser's Edge
The Raiser's Edge Financial Dashboard Part V - How to Extend It Further

Sunday, June 2, 2013

A Case Study: Excel report generation combining data from multiple Excel workbooks

I was approached recently by a client to see if there was any opportunity to help them streamline how they generate reports for some of their clients.  They had a situation where they had numerous excel spreadsheets that needed information consolidated down into one spreadsheet and vlookups just couldn't cut it.  These numerous spreadsheet reports were similar but they were cumbersome to create as it required lots of manual copy and paste, transforming of data, looking in other spreadsheets, searching for codes, copying information and pasting in the other spreadsheet.  All told, they had a frustrating process that took too many hours or days to create these worksheets and often times there were errors due to humans doing the work. 

This screamed out to me that this is the perfect opportunity to improve how they work.  Why?  Well, at its core was a repetitive process that took way too long to do manually.  As long as there was a consistent process and logic that could be written in code and the client agreed to adhere to a few rules and consistencies in the spreadsheet, this would be a huge time-saver for them.

So what I did was create a macro in the primary Excel workbook that did the following:
1.  Create a new worksheet to the create the report
2.  Reads a specific worksheet they do their daily work from and grabs some key pieces of data to insert into the worksheet created in step 1.
3.  Prompts the user to select the other workbook to reference to pull data into the worksheet created in step 1 (think of this as "lookup tables" to fill in additional information based on a code).
4.  Reads the workbook selected in step 3 to fill in additional data into the worksheet created in step 1.
5.  Format the worksheet created in Step 1.

There was obviously some more detail within each of these steps, especially steps 2 and 4.  However, the key was there was repeatable logic that could be created within these steps.  For example, while putting together step 2, in one instance we had to check to see whether or not a code already existed, and if it did, don't write it again. 

The client needed to agree to a few conditions in order for this to work:
1.  The source worksheets they update continually need to have the header rows be the same all the time and some columns need to have the same text in the header cell and possibly be in the same location each time.
That is it - not much to give up really.  In fact it ensures they do things consistently across their group.
2.  The source worksheets data needed to adhere to standards.  As long as the expected data was in the worksheet and the logic to read the data was repeatable, then all systems were go.

Some may think they can just record a macro, going through the process of doing it once manually, without the need to have someone with skills to write VBA code.  However, there are a few fatal flaws in this line of thinking:
1.  The source data may have any number of columns and also any number of rows of data.  Recording the macro does not take this into account and will result, at some point, into data being left out.
2.  When referring to another spreadsheet to pull data in, you must refer to the same workbook every time with recording a macro.  By using code, a custom form can be created that allows the user to select the workbook they want to reference to pull data in, allowing for greater flexibility.

At the end of the day they got a tool that:
1.  Was a huge time saver, freeing them up to do other things.
2.  Created numerous reports within seconds
3.  Was setup in such a way that previous reports would not be overwritten, creating a history if needed.
4.  Allowed users to have multiple copies of the workbooks, and even the workbook they needed to reference to pull data in, to account for different workstreams, different customers, and allow for historical archiving of workbooks.

If you have a similar problem with Microsoft Excel, contact us at Tucamino Solutions to see how we might be able to help you.  This type of solution also works well with querying data from a database, or even multiple databases, to pull data into Excel and format in a consistent manner.  You will be surprised how affordable these solutions can be and how you can get great ROI on this as it frees up your time to do other stuff than formatting and pulling data together in Excel.

Friday, May 31, 2013

The Raiser's Edge Financial Dashboard Part II - The Big Picture

In our previous article we talked about the why of the Raiser's Edge Financial Dashboard, an interactive reporting tool designed for a wide range of Raiser's Edge organizations and their employees.  In our first more detailed peek into the Raiser's Edge Financial Dashboard reporting capabilities, we are going to focus on the "Big Picture" the dashboard presents. 

The Home Page, or Main Dashboard, pictured at the right is a collection of data tables/grids and graphs displaying information in such a way that an executive can get a clear idea as to how much money has been raised, where it has been allocated, as well as performance compared to last year or previous years.  In addition, it shows a forecast as to how much money will be coming in.  So lets look at each of the components of the main dashboard...


The first dashboard component is the YTD Summary.  This component in The Raiser's Edge Financial Dashboard gives a view as to how much actual cash has been raised this year. 

In addition, when considering what "This Year" means, we have accomodated both the Fiscal Year and Calendar Year.  In addition to total dollars raised, the average gift and the number of gifts is displayed.  Total amount raised is important, but another measure of performance is the average gift.  The lower the average gift, the more donors or actual donations are needed to meet budgets.

The second Raiser's Edge Financial Dashboard component is the 12 Month Period Comparison, or recent yearly performance comparisons.  This component is meant to show multiple 1 year periods of Total Amount raised, Average Gift, and Number of Gifts.  This allows an organization to see a trend when they can compare the last 12 months (as of the day of the report) when compared to the 12 month period ending a month ago, 6 months ago, and 1 year ago.   For example, if Today were 12/1/13, the Today column shows metrics for the period of 12/2/2012 to 12/1/2013.  The Last Month column would be the period of 11/2/2012 to 11/1/2013; 6 Months Ago would be 6/2/2012 to 6/1/2013, etc.  Again, this gives a quick snapshot of how the organization is trending (few donors and more money raised, more donors and less money raised, etc).

 For each 12 month period, there is a +/- column which shows how the current 12 month period (ending today) has done against the previous 12 month period.  If the value is in red then that is bad.  For example, in our picture to the right, when we compare the 12 month period for Today against the one for 6 Months Ago, the 12 month perioding ending today has only raised 89% as much as the period from 6 Months ago but the average gift is 143% of the 6 Months Ago time period. 


The next two components, shown at the left and right, show how the money has been allocated for that which has been raised this Fiscal Year.  The two pie charts show a breakdown of donations to Campaigns and Funds.  The FY Campaign Year-To-Date has the donations for the Campaigns for the current Fiscal Year.  The Fiscal Year is determined by the setting in the Raiser's Edge Configuration General Settings.  If you believe the Raiser's Edge Financial Dashboard is reporting incorrect information for Fiscal Year, then contact your RE Administrator to verify the Fiscal Year is setup correctly.

These charts may give someone an indication as to where particular funds or campaigns may need special attention to meet their goals for the current year.  When mousing over the Campaigns or Funds in the charts, the amount for the respective Campaign or Fund is displayed.  This is just one of the features and designs that exists in the Raiser's Edge Financial Dashboard to not crowd the dashboards and reports but allow quick access to details and drill-down capabilities to more information.

To carry on the Trend Analysis capabilities of the Raiser's Edge Financial Dashboard, a line graph was developed which shows the last 3 years of donations, per month. 

As shown on the graph to the left, each year is given its own line and when laid on the same graph, a trend may possibly emerge. For example, a trend may emerge showing that during the month of December each year you get a spike in donations due to your donors contributing before the end of year for tax purposes.  But the key is that a trend may emerge allowing you to work smarter and more efficiently during certain times of year.


Finally, when considering the importance of cash donations, one must look at those cash donations that have not been paid but should have been, or unpaid pledge installments.

The Pledge Installments Overdue Analysis component, shown at the right captures these past due pledge installments.  It also segments these pledge installments so that someone may be able to see a total amount, average installment, etc. for a period of time (the amount of time the pledge is overdue). 
Another important consideration for the Raiser's Edge Financial Dashboard is the amount of cash expected, or upcoming pledge installments due.

The Pledge Installments Forecast, shown at the right of the Raiser's Edge Financial Dashboard, shows visually how much money is due in the next 12 months, as recorded in The Raiser's Edge.  This helps to give some indication as to expected revenue coming in so workload can be planned based on this expected revenue.

Another beauty of this is the core of dashboard is already developed.  Perhaps it doesn't fit your use 100% but with a slight tweak you can get more use from it.  We can do that for you at a fraction of the cost of building out a dashboard application from scratch.  Just contact us at Tucamino Solutions to see how we might help you.

Check out the other posts in our series at:
The Raiser's Edge Financial Dashboard Part I - The Overview
The Raiser's Edge Financial Dashboard Part II - The Big Picture
The Raiser's Edge Financial Dashboard Part III - Drill-Down Analysis
The Raiser's Edge Financial Dashboard Part IV - True Integration with The Raiser's Edge
The Raiser's Edge Financial Dashboard Part V - How to Extend It Further

Sunday, May 26, 2013

The Raiser's Edge Financial Dashboard Part I - The Overview

As I have been thinking about what The Raiser's Edge is missing, one area jumps out more than others:  Reports, Business Intelligence, and Data Visualization.

As I talk to other users of the Raiser's Edge and view blog posts, questions posed in user groups and online forums, it strikes me how limited people are in how they can actually use data.  They have no idea how to take action on the data they have to do something that is going to help move their organization to action in a way that will IMPACT their organization. 

In order to impact their organization, an employee needs to be able to focus their time and attention on something that will make an impact.  That means different things to different people.  But in order for someone to do their job effectively they need to be able to see data in way that tells them a story, tells them what to do, and brings attention to areas that need it.

Circling back to The Raiser's Edge, the built in reports are really inadequate.  They are mostly textual static reports.  The "Custom Reports" feature is limited by the fact that Crystal Reports is a flawed reporting tool itself and is encumbered by having to deal with data that is limited by the export feature of The Raiser's Edge.  The dashboards are nice but after a while they get stale and they are pretty limited as well.  And it is sad, most organizations think this is what they have to work with.  I bet many have individuals on staff that "compile" reports in a labor intensive process to get something that is in a better format than what they have available to them.

So that got me thinking about developing an example of one way to tell a story about the financial health of an organization.  As I think about financial health, what I would want to know is:
1.  What is our revenue, or cash gifts, for this year?  This tells me raw numbers so I can see what the organization has generated in cash. 
2.  How is that revenue broken down (by campaign and by fund)?
3.  How are we doing over the last 12 months compared to other, recent 12 month periods?
4.  What is our expected revenue?  So this is what someone has told us they are going to give us in the future.  In RE lingo, this would be my Pledge Installments or possibly Recurring Gifts "Installments".
5.  What is my overdue revenue?  This can be thought of as the money someone pledged to us and did not pay.  They may not have paid because they lost their job, or perhaps they forgot, or God forbid, we forgot to remind them!!!

Raiser's Edge Financial Dashboard Main Dashboard Screen

All of the above focuses on CASH!!!  In my opinion, coming from the perspective of the amount of cash raised and cash expected is the bottom line for an organization in terms of sustainability and the ability to continue to fulfill a mission.  So I purposely did not add a "pledge" as revenue, or cash, for this year.  A pledge is great but it might not get fulfilled.  In addition, recording the pledge and the expected installments allows for forecasting of cash (another huge piece of information to tell an organization how their future financial health is looking).

OK, so what.  When you take the above, you get a picture of financial health (current status, current compared to recent, aka Trend Analysis, plus expected future money).   Again, so what?  Well, then if that Dashboard is interactive then the "reports" come alive.  Imagine being able to drill down into other dashboards or summary reports, see the details behind a segment of data (e.g. list of gifts over a period of time or for a campaign), then being able to drill down into a gift itself.  That can be pretty powerful! 

Raiser's Edge Financial Dashboard Year Summary

Not to mention, an Executive Director or VP of Development, or Board Member, can view these dashboards in a way that helps them make decisions, to align resources to what the organization needs, and not have to rely on static reports sent by email, followed up by more email "requests for information", etc.  The people that are typically responsible for making those reports can then spend their time on carrying out the actions that are going to benefit the organization.

The Raiser's Edge Financial Dashboard is also designed in such a way that it integrates with The Raiser's Edge.  A user may select to leverage the RE:API to log into The Raiser's Edge or choose to enter the SQL Server connection details.  This gives users and organizations flexibility on how they want to deploy the solution.  By using the RE:API additional functionality, described in Part IV of our series, users will get additional functionality.  Though it comes with a cost because a concurrent license is used to view the dashboard this way.

The next few articles in this series will focus on the details of the RE Financial Dashboard.  I hope you get the value out of them and want to try it out.

Check out the other articles, coming soon, in our series:
The Raiser's Edge Financial Dashboard Part II - The Big Picture
The Raiser's Edge Financial Dashboard Part III - Drill-Down Analysis
The Raiser's Edge Financial Dashboard Part IV - True Integration with The Raiser's Edge
The Raiser's Edge Financial Dashboard Part V - How to Extend It Further