
Microsoft Excel
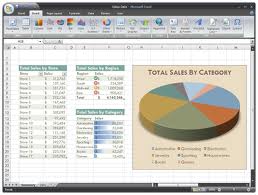 One technology that nearly everyone uses, but many don't have a "super-user" grasp of, is Microsoft Excel. Once data lands in Excel it is amazing what people can do with it. And I would be willing to bet that many RE, non-techie users, can at least get the data into Excel via Export or Query. Once the data is in Excel, developers, or power-users can then get very creative and write VBA macros, or leverage Pivot Tables and Charts, and use conditional formatting among other things to generate reports and dashboards that can easily be shared. Dynamic filtering can be implemented to let users get a different picture of the data.
In addition, through add-ins and macros, these reports can be automated such that executives and directors, or even other users, can pull the data at the click of a button, without having to log into RE and develop queries and exports. Heck, once it is in Excel, these reports can be posted onto SharePoint and rich reports displayed on web pages in SharePoint.
Update - Go check out this Microsoft Add-In which reports on The Raiser's Edge recurring gifts that I have created to show you how you can leverage Microsoft Excel a bit better.
Microsoft Access
 Another application in the Microsoft Office suite of products is Microsoft Access. Data can be imported or linked through Access and then presented in a way that can be reported on. Queries can be written, views created, forms generated, and data can even be taken offline for times when disconnection to The Raiser's Edge ensues. When using Access, one must be careful to not update data directly in the SQL Server backend as the database could be corrupted with "bad data" that does not adhere to The Raiser's Edge front-end application.
 SQL Server Reporting Services (SSRS)

SharePoint Web Parts

Check out my post on displaying a webpart in SharePoint reporting on Raiser's Edge data as an example.
Custom Application Development
Having a software developer create a dashboard application, or an application that contains dashboards, is a great way to have your Raiser's Edge data tell you a story. A Dashboard application must serve another purpose as well to be worth the investment. Maybe these reports need to come alive and offer drill-down capabilities, such as our Raiser's Edge Financial Dashboard. Or maybe they have some further integration capabilities with the Raiser's Edge. Even a Raiser's Edge plug-in could be created that is available from within The Raiser's Edge itself that provides additional reporting and dashboarding capabilities. Whatever the extra requirements you have, custom application development can go a long way.There are many other Business Intelligence (BI) and Analytics tools out there, such as Tableau, Spotfire and Logi, that can access a SQL Server database (which most Raiser's Edge customers use). What I have presented to you is just a snippet of opportunities that many of you may already have in-house. If you are hosted by Blackbaud then your options are severely limited. There are other options out there should you want to explore those to allow you to improve your investment in The Raiser's Edge. Should you want to explore one of these options or see what may be best for your organization to get more out of your Raiser's Edge investment you can go to our website for Tucamino Solutions and contact us via our website.
Now you can become a tableau certified associate by passing the certificate exam and for this purpose you need to take take a look at best tableau certification dumps
ReplyDeletemmorpg oyunlar
ReplyDeleteİnstagram takipci satin al
Tiktok jeton hilesi
Tiktok Jeton Hilesi
antalya saç ekimi
REFERANS KİMLİĞİ NEDİR
İnstagram Takipçi Satın Al
metin2 pvp serverlar
instagram takipçi satın al
smm panel
ReplyDeleteSmm panel
İş ilanları blog
instagram takipçi satın al
hirdavatciburada.com
beyazesyateknikservisi.com.tr
servis
tiktok jeton hilesi
alsancak
ReplyDeleteçankırı
düzce
gaziemir
kaş
7O2E
beşiktaş
ReplyDeletebakırköy
zeytinburnu
adapazarı
izmit
8P85WD
شركة مكافحة البق بالرياض
ReplyDeleteشركة مكافحة بق الفراش