Showing posts with label Raiser's Edge. Show all posts

Wednesday, December 17, 2014

The Raiser's Edge Data Profiler: Improve your RE Data Quality

So perhaps you checked out my post about data profiling.  Something that has been knocking around in my brain in conjunction with that post: I have created the beginnings of a Raiser's Edge Data Profiling tool.

When I set out  to work on this tool for The Raiser's Edge, first and foremost I thought it needs to be user-friendly; where someone without any technical skills (e.g. writing SQL), could run the application and gain valuable insights into their data.  As a result I think I have a tool that is a must for every organization to own and use.  I usually create stuff and give them away for FREE, but I think this product is so revolutionary in where it will be heading in the future that I am trying to figure out a pricing structure for it.  But at the end of the day it will be priced so that everyone can afford it, likely without any high, upfront costs as is typical for much of the software today, but perhaps a subscription model.

What makes the application compelling and worth spending money on?  Well, to my knowledge, there is no product out in the marketplace that has taken the best practices for profiling data and made it available in a product for The Raiser's Edge.  If you were to profile your data you would have to have someone with the technical expertise to use tools such as SSIS and Informatica Data Quality to create profiles that allow you to measure, evaluate, and discover data problems.  But these have problems as they don't allow for the integration with The Raiser's Edge or they are crazy expensive.  Would you rather spend tens of thousands of dollars (if not more) or likely just hundreds (pricing TBD) each year?

In addition, the application allows you to look at your data from a whole new perspective.  It is designed to allow you to view this data in such a way that you can discover where you have data issues.  For example, you may have a segment of your constituents (or profile view as it is called in the application) where the Title 1 is equal to "Mr.".  In the profile view you will see all of the different genders for this segment of constituents, including potentially any genders that are "Female" or "Unknown". Well, this is a problem that you likely want to fix.  The tool can't fix this issue, at least not yet :), but it has clearly pointed out and made visible to you where a data issue exists.

Before we get into it, lets hit some of the highlights (or goals), of what I wanted to accomplish and what the product offers:

  1. Best practices data profiling results for segments of Raiser's Edge records.  This includes reporting on the number of unique values and % unique, number of null values, % null, number of zero length strings and % of total, maximum and minimum values and string lengths,
  2. Data mining capabilities to allow someone to easily mine the set of unique values (and their frequency) for a column in a segment.  For example, if I were profiling those constituents that are Board Members, perhaps I want to see the unique values for state and the number of constituents with those states within my board member segmentation.
  3. Drill-down capabilities to see the details for records that fit a specific segment.  Using my board member example above, I could then "drill-down" on those board members that live in South Carolina and see all of their details (e.g. Name, Address, constituent flags, etc.)
  4. Integration with The Raiser's Edge.  The application allows you to open The Raiser's Edge records (Constituents, Gifts, Campaigns, Actions, etc) directly from the application.
  5. No writing SQL, easy to use for non-techies!
  6. Dynamic generation of segments to profile.  For example, the application automagically creates profile views (my name for segments of records) for constituents for each of the constituent codes.   Thus pre-canned profiles are already available for all of your constituent codes, as well as many other code tables and records.
  7. Take the idea of data profiling and let it be another query engine for The Raiser's Edge, giving users another tool to gain insight into their data (beyond statistics and profiling).
  8. Ability to grow and extend the application from the first release!!!


Lets take a look at some of the screen shots for the application (currently in beta form and available for trial downloads).


At the left you will see an unassuming, clean list of segments of records within your data, aka profile views, listed on the main form.  The profile views are organized cleanly in a tree structure with folders and other organization nodes.  Out-of-the-box a wide variety of profile views are available (with more to come).  In addition, there will be new functionality added in the future allowing you (the user) to add, edit, and delete "custom" profile views of your own.  We are not quite yet sure how this will function as we want to make it as user-friendly as possible (without you having to write SQL or perform complex, techy tasks).

You can run the profile via a button on the toolbar, right-click context menu with the mouse, or just double-clicking the profile view.  Once you "run" the profile view you will then have the form loaded with the details (as seen below). The Profile View form shows the core data profiling statistics for each column in the main table (top left).  However, you have powerful capabilities, for each column to "mine the values" to see what are the different values for a column and how frequently they occur (top right table).  And finally you can then drill-down, from the list of values and their frequency, to view the details of specific records within that profile view for a specific value of a column (bottom-table).


Right-click menus are used heavily on the Profile View form seen above.  There are numerous options when right-clicking with your mouse that are not readily available on the toolbars, with buttons, for each of the tables.  For example, as seen below, right-clicking on the Constituent Address Country column for the profile view below, I can mine the values for that column in many different ways and see the results in the table at the top-right of the form. I can even refresh my profile or export the profile view results - pretty cool.


I can also right-click on the values list table and drill-down to see the records which have a specific value for a column in my profile view.  As seen in the screen-shot below, I can view the records that have a date from, in my constituent code, which is NULL.  These records would then show up in the bottom table of the Profile View form.


Once you have drilled down on records you can even right-click on a specific record in the drill-down table of the form (bottom table) and select to open the record (in its native Raiser's Edge application form no less), e.g. see Robert Hernandez's constituent RE form below.


This is only the beginning.  We have tons of ideas in our plans to continue improving this product. Go request a download and get a trial version.  Give it a whirl and provide us some feedback.  If you have any questions go to our contact page or send us an email.

Check back later and we will hopefully have more posts on the Raiser's Edge Data Profiler!

Wednesday, October 22, 2014

Tableau Test Drive for Raiser's Edge Reporting - Worksheet Map

This is part IV in our series of looking at Tableau as our RE reporting solution.  You can see the other posts in the links below:
Part I - Installing Tableau
Part II - Connecting To RE and Planning our Dashboards
Part III - Our First Worksheet

In this installment we will now create a map showing where our constituents are located.  The first step is to create a new worksheet in Tableau.  After doing that we selected the map "chart" type to display our data.  We have selected State as our point of departure for  map information and again the count of records.  This map already begins to tell us a pretty compelling story in a very cool way:  most of our records are on the east coast with our biggest concentration in the southeast, specifically South Carolina.  But that is no surprise for our Raiser's Edge users who log into and play around with the sample database (the source of our data for this example).

Simple map of our Raiser's Edge records and relative number per state

Now that we have our map we can do some interesting things to "spice it up" as my wife likes to say.  So I brought over the primary constituent code dimension field into the Color section and the map becomes richer.  Now we can see colors associated with each state, telling us which constituent codes exist in the state on the map and their relative numbers.  Pretty cool.

Constituent Codes now showing up in each state

After taking a look at the map, I thought the size of the circles on each state was pretty small and difficult to read.  So I adjusted the size of the circles for the number of records for each state and the map now becomes a little easier to read.

Map after adjusting the size of the circles showing the number of records

Your map could be busy and you might want to add additional filters, such as for state, or other dimension fields.  My dataset is including all of the records in RE currently (constituents and non-constituents, aka individual relationships not linked to constituents).  So I am going to add a new filter to show the results for constituents only (Is Constituent = -1).

After adding the filter, the data is adjusted to show only constituents


There we have it, now we have a map of a breakdown of our constituents, based on constituent code and where they are located.  We could make this more specific and do some dynamic stuff like selecting a constituent code to show the results for a specific segment of our constituents, based on constituent code.

Wednesday, August 27, 2014

Tableau Test Drive for Raiser's Edge Reporting - Connecting to RE and the Planning

Now that we have Tableau Desktop installed, it is time to finish some basic setup, which includes establishing a new connection to The Raiser's Edge so that we can begin actually creating our dashboards and reports.  But to establish our connection we have to do something else:  Figure out what it is we actually want to report on.

To keep it pretty simple, I decided that I would create some dashboards and reports based on basic constituent demographics; stuff like preferred address details, primary constituent code, whether they were deceased, inactive, or an individual vs. organization, etc.  Then I said,what might I want to see and I spent about 5 minutes sketching out on a plain sheet of paper some demographic dashboard components (see the image below).  I recommend that you spend more time if you were planning your own.

My rough (very rough) sketch of the dashboards I wanted

Once that I established some rough estimate of what my dashboard and reports might look like, I then had to figure out how I was going to get that information.  As most of you know, getting info from The Raiser's Edge can, at times, be a bit complex.  So I knew I wanted preferred address.  I could have chosen all addresses but figured it made sense to keep it simple and only get the preferred address.  Then I decided that I wanted constituent codes, but again I decided I only wanted the primary constituent code (the one that is at the top of the list on the records Bio 2 tab).  And finally, some information from the record itself (deceased, full_name, etc.).

Now that I established what I am pulling from the database, I then had to figure out how I was actually going to get that info.  There were several ways to do it.  I could create a view in the actual Raiser's Edge database that pulls all of that together, then in Tableau I just pull the info from the view.  I could write my own custom SQL in Tableau (which is essentially writing the same SQL for the view option above).  And finally pull in all of the tables into Tableau and try to do some fancy joining in the tool.  To be honest, based on what I am doing, I am not even sure if Tableau could have done that - but I am going to assume that it could, but I chose not to.  I went with option 1, create the database view:  it seemed the easiest to do at this time so that I could focus on the dashboards and workbooks in Tableau.

Some code of the view I created on the RE Database

So now lets create a new connection in Tableau to our view.  From the home page, select the "Connect to Data" link on the left sidebar.  Then you will see a list of native connections that Tableau supports.  You will select Microsoft SQL Server from the list connections.  This is pretty basic connection information, just as if you were connecting to the Raisers' Edge server instance that the RE database exists on via SQL Management Studio.  Enter your details and select "connect".

Connecting to SQL Server in Tableau

From there you will then select the Raiser's Edge database in the dropdown at the left.  Once you do so, all of the Raiser's Edge database tables and views, as well as stored procedures are loaded for your selection.  This may take a few minutes to load. Once loaded, you can then select the tables, views, etc. that you want by dragging them to the top box in the main part of the form.  This is where you can bring multiple tables or views over and create joins on them as I mentioned earlier if you like.  For my case, I have 1 database view already created that I selected.  I also decided to add some gift information to my view just in case I need it for other dashboards.


Connected to the Raiser's Edge and selected the view to use

Once you have selected the tables and views that you want, you can then customize the connection by changing the field names, changing the datatype, etc. in the grid at the bottom panel of the main section of the form (as seen in the screenshot below).  Once you have everything setup for the data you want to be used in your workbook, click on the "Go to Worksheet" link in the middle orange section of the form and you are ready to build your dashboards.

You can also choose to have this connection setup to use the Live data or to Extract the data into the Tableau "Fast Data Engine" which allows for offline reporting and doesn't affect the performance of your live Raiser's Edge database.  This will be an area that hopefully I can explore - pending how much time I have left in my trial.


Again, all in all, pretty straight-forward and pretty easy.  Tableau continues to be very user-friendly in terms of installation and getting setup.  I thought the real fun would start after my last post (and designing your dashboards is fun), but in the next post we will create our first worksheet/dashboard, or something:)

Other posts in our series can be found at:
Part I - Installing Tableau
Part III - Our First Worksheet

Tuesday, August 26, 2014

Tableau Test Drive for Raiser's Edge Reporting - Installing Tableau Desktop

With the advance in all of the BI and Analytics tools in the marketplace, I thought I would give one of the most popular a test drive:  Tableau.  Below are other posts in the series:
Part II - Connecting To RE and Planning our Dashboards
Part III - Our First Worksheet

Tableau has numerous offerings in their suite of products including Tableau Desktop, which appears to be the primary one you would 'develop' your dashboards and BI reports, Tableau Server and Tableau Online, which appear to be engines where your developed dashboards and reports can be published for consumption by others in your organization.

So lets see how easy it is to get started on Tableau Desktop.  The first step is going to the Tableau website and requesting a download of Tableau Desktop:  easy.  You can go to Tableau Desktop and click on the Try It Free link to start your download.

The Tableau Desktop webpage with the Try It Free link

The size of the download was only a little over 100 mb, so not too big.  Once you have downloaded the software, just go find the setup executable on your hard drive and double click on it. The Windows installer is launched and you get a rather simple wizard.  The first screen just allows you to view the License Agreement and to provide some minimal customization of the product.


After clicking the "Install' button, you get the typical "Installing" wizard form with a status label and progress bar.  It only takes a minute or two for the actual installation to take place.

Once the installer is completed, Tableau is launched and you can start your free trial, 'start trial later' (which I recommend if you know you can't start playing around with the tool immediately so you don't waste valuable days of your trial), or activate your product.


Wow, that was easy.  Installing Tableau Desktop was that easy.  Now comes the more difficult, and much more fun, part - creating BI and Analytics dashboards and reports.  So lets give it a spin and see how it performs and the cool features it may have.

When you first start your trial, Tableau was nice enough to have some sample "workbooks" which appear to be their "projects" that you create your dashboards and reports in.  I think these samples are actually pretty good.  In addition, there are valuable links to training videos that you can watch, which are pretty darn good as well.  

Sample workbook that  comes with Tableau Desktop
All in all, a pretty positive first impression from Tableau.  I did initially install on one of my laptops running Windows 8.1 and it would crash (the blue screen of death) due to various issues, mainly memory issues even though I have enough.  My Windows 7 laptop (ironically with less memory than the Windows 8.1) had no issues whatsoever.

Up next, lets plan out our first workbook and get connected to RE.


Monday, July 15, 2013

Using BCS to report on Raiser's Edge information in SharePoint - Part I

Following up on our earlier post of Some Possibilities to Display Raiser's Edge data in SharePoint, I am going to turn my attention to the Business Connectivity Services (BCS) functionality.  BCS, formerly known as the Business Data Catalog, is intended to provide "out-of-the-box" integration capabilities with other data sources. This integration provides external data in a SharePoint list, with it looking and acting like a SharePoint list, even though the data continues to "live" in the external database.  Once this data is consumed in SharePoint, the end-user gets the benefit of SharePoint views, column sorting, filtering, plus much more.

The integration also means view, edit, add, and delete capabilities on these non-SharePoint datasources (think of SQL Server databases).  The Raiser's Edge runs as a SQL Server database, thus we can grab this information and leverage BCS to provide that information to our end-users.  This same concept can be applied to any other SQL Server database, but we will focus on The Raiser's Edge for this post.
Raiser's Edge Proposals shown in SharePoint via BCS

At first blush some may say, wow, that is pretty awesome.  Others, myself included, may become very wary of all of those capabilities.  For instance, I have found that most COTS solutions that leverage SQL Server have a highly normalized database with many relationships, or foreign keys, throughout the database tables.  So to pull information from the source database into a format that is consumable and makes sense to the end-user, views may need to be created that join these many tables to get at the actual values that are important (a text value instead of numeric ID for example).  When you think in these terms, the "View" capabilities are much more powerful than the Create, Update, and Delete (from CRUD).  I know there will be instances, probably in more homegrown databases designed to work with the SharePoint BCS, where all CRUD capabilities can be pretty powerful.

With all that being said, lets take the BCS for a spin to pull Raiser's Edge Proposal data into SharePoint so we can provide that information to our wider business community.  The first thing we need to do is to create a view in SQL Server to select the proposals from The Raiser's Edge. The Proposal table in the Raiser's Edge has lots of foreign keys (or references to other reference data or code table data) and alone is insufficient.  By creating a view in SQL Server we can join the Proposal table to these other tables (Tableentries, Campaigns, etc.) to display the textual values for these columns.


After setting up the view in SQL Server, we can open up SharePoint Designer to perform the next series of tasks.  External data is exposed via External Content Types in SharePoint.  We created a new external content type and named it REProposal.  After the initial creation (as seen below) we have a base external content type from which to expose this Raiser's Edge proposal information in SharePoint.  We still need to do some configuration of this external content type.


Now that we have the external content type defined, we need to configure the connection to the SQL Server Raiser's Edge database.  There are multiple connection types for the external content type, but I have chosen the SQL Server.  This connection type allows for the extraction of information directly from the SQL Server database.  After establishing the connection, we then have the Raiser's Edge tables and views, as seen at the right, available for selection.

Because I created the view that exposes the Raiser's Edge proposal information in the format that I want, I navigate to the view I created by expanding the Views folder.  When we find our view, we right-click on the view to see which operations we can then include in our external content type.  As I mentioned previously, we could have full CRUD capabilities but I believe this is not appropriate,  at least for what we are trying to accomplish today.  We need to select two operations: Read Item Operation and Read List Operation.  Read List provides the capabilities to pull the entire dataset and Read Item exposes an individual item in the list for view (such as an item dialog form to see the item's details).  These operations are seen at the left.  There are some further configurations that need to take place with the columns.

Now we have the external content type created, we must create a List with this external content type.  This option is available in the Ribbon of the external content type in SharePoint Designer.
Once the list is created, lets navigate to the list in SharePoint.  So I open Internet Explorer and navigate to the URL that the list should have been created at.  Uh-Oh.  Take a look at the right:  I must have forgot something, I am getting an "Access Denied" message when I was expecting the list of Raiser's Edge proposals. 

I forgot to set the permissions on the external content type in SharePoint Central Administration.  I forgot to navigate to the Application Management, BCS service application management section to set the permissions, as seen below on the external content type I created.


Now after setting the permissions, I am able to navigate to the list in SharePoint and I have my list of Raiser's Edge proposals.  I can now use this list as if it were a SharePoint list, even though the data itself resides in the Raiser's Edge SQL Server database.  I can create custom, filtered views, add a web part to a web page with a specific view of the RE Proposals, or do any number of things with the list of proposals, as if we were managing it in SharePoint.  This type of functionality can be created on many types of datasources, including other SQL Server databases.  Coming soon, another post that then takes this external list of data to show how it behaves like a normal SharePoint list.  Contact me at Tucamino Solutions if you need help leveraging this kind of functionality at your organization or want to find out how else we can help you.


Friday, June 21, 2013

Displaying a Raiser's Edge Gift List in a SharePoint page with an ASP.NET Web Part

In an earlier post I wrote about some of the possible ways Raiser's Edge data could be reported or displayed using SharePoint, allowing other people in your organization to access these reports, dashboards, and lists without having to log into The Raiser's Edge.  Today we are going to focus on one of those ways:  using the available ASP.NET web controls or web parts in SharePoint Designer.

In this post I am going to focus on creating a simple recent gift list displayed on a SharePoint web page.  As mentioned in the previous post, there are many ways to go about this.  For those developers that know how to use the ASP.NET web parts, a quick and easy way to accomplish this is to drop one of the available web parts onto a Web Part Page, connect the web part to the Raiser's Edge database, write the SQL statement, and format the web part - pretty simple!!
The first step is creating a new web part page.  We need a place that we want to display the gifts and the natural location is to create a Web Part Page in a library that is on the site.  You may want to create your own library for pages, or use the built-in Site Pages library.  It is really up to you.  In addition a Wiki Page may present problems, thus we recommend that you create a Web Part Page.  When creating the page we selected a layout that was one column as we are only going to have one web part on the page and we want as much real estate hortizontally as possible to add as many columns as we might want.

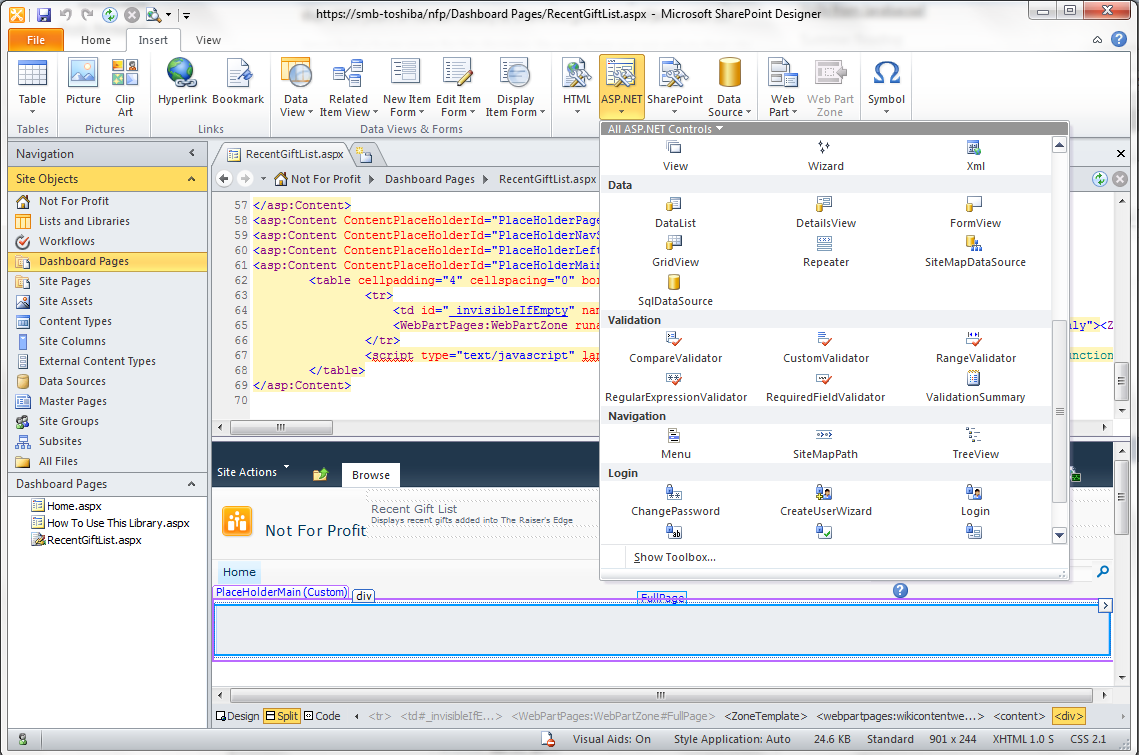
After creating the page, I open up the site with SharePoint Designer, check out the web part page, and open the page in design mode.  When in this mode you can add SharePoint web parts as well as other web parts.  As mentioned above, we are going to use an ASP.NET web part (some of these are pictured at the left).  We are going to choose the GridView for its tabular or grid format, simple rendering of the data in a list format, and easy styling the control to make it a bit more professional.
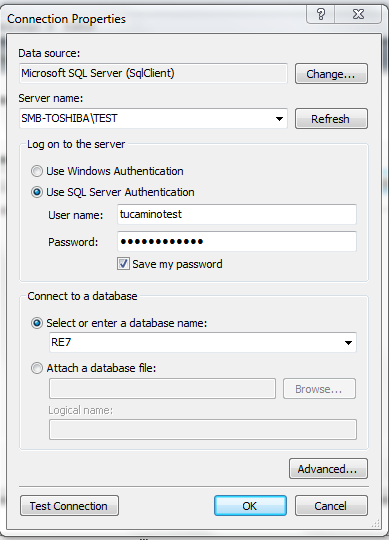
After placing the GridView web part on the page, we need to tell the web part how to connect to The Raiser's Edge database.  To do this we create a new data connection.  When setting up this connection, you will be presented a similar dialog form to many of the sql tools and utilities in the marketplace.  Because The Raiser's Edge is a SQL Server database, we select this option then enter the appropriate details to connect to the database.  I recommend that you have your administrator create a new SQL Login and provide it the appropriate privileges (read-only to protect the integrity of the data).  Note, this SQL Login is not the same as the "new user" created in The Raiser's Edge application, but a SQL Login created via the SQL Server Management Studio.   We entered the SQL Server instance where the RE database resides, the SQL Login user name and password, along with the Raiser's Edge database.  I recommend that you also click the "Test Connetion" button to ensure that the connection details you have entered work!

 
Now that we have the connection details defined, we need to write the SQL to pull our gifts.  As many of you may know, writing a SQL statement to pull information from The Raiser's Edge may not be a simple SQL.  I tried to display enough information to keep it interesting but not go too overboard.  I also chose to pull just cash gifts as well (see the WHERE G.TYPE IN (1,2,3,31) at the left).  We could write a function to be included in the SQL to show the gift type and allow all gift types to be displayed, but this shows how we can really get at specific information in our reports.

After writing the SQL we then have a Grid View that displays a rough outline of how the grid is going to look.  I chose an out of the box "Professional" style which applied the formatting to the headers, columns and rows.  You could really spend a lot of time customizing the look and feel of the GridView and the individual elements, but for our exercise I thought keeping it simple was the best approach.

Now that we have the SQL written, a connection to the database configured, and the web part styled, it is just a matter of checking in the web part page and opening the SharePoint site to see how it looks and making any edits we might need to.  Below is the outcome of our little project: a web part page that displays recent gifts sorted by the gift date, with the most recent at the top.  Someone that wants to see this information doesn't have to log into The Raiser's Edge or ask someone for the "report", they can just go to the web page to see the information.  Obviously you can extend this type of functionality to dashboards, other reports, adding filtering and search criteria to make it truly dynamic and powerful, even create a mini RE application (having one page that shows constituent information about a specific constituent, another for a campaign, etc. and connecting via links embedded on the pages - now that would be fun).  And the best of all is someone doesn't have to log into The Raiser's Edge to get this information; they can get it on-demand, and it looks professional.


If you would like to explore this type of functionality or run an idea by us, please go to our website to see what else we can do for you or send us a contact us request.  I would even love to hear what other ideas you would like for me to explore on this blog that you think could be powerful, especially if it pertains to The Raiser's Edge or SharePoint.   Also, I want to say thanks for checking out my blog.  If you have any feedback, don't hesitate to reach out to me via this blog or the website referenced above.