Showing posts with label Tableau. Show all posts

Thursday, October 23, 2014

Tableau Test Drive for Raiser's Edge Reporting - A Bit of a Deeper Dive into Demographic Reporting

In the final post in this little series, I am taking a deeper dive into reporting on other demographics using Tableau.  You can check out the other posts in this series below:

Part I - Installing Tableau
Part II - Connecting To RE and Planning our Dashboards
Part III - Our First Worksheet
Part IV - Worksheet Map

As I mention above, this post will focus on taking more demographic information from The Raiser's Edge, such as Deceased or Inactive, and exploring how we might report on this information in Tableau.  First we are creating a new worksheet.  We drag and drop the Deceased dimension into the Columns section and Primary CC (Constituent Code) into the Rows section.  Then we drag the Count of Record IDs into the table to report on the number of records.  Great, we can see which constituent codes are marked as Deceased (-1) or Not Deceased (0).  This could be valuable information if we saw that we had some key constituent code with a record marked as deceased.

Basic worksheet showing deceased/not deceased count by constituent code

Well, for a non-technical person have Deceased values of 0 or -1 is not very user-friendly.  But these values are what is stored in The Raiser's Edge database.  Tableau offers the capability to change how this is presented.  I have changed these values to No or Yes, which to a "business" user is much easier to understand.
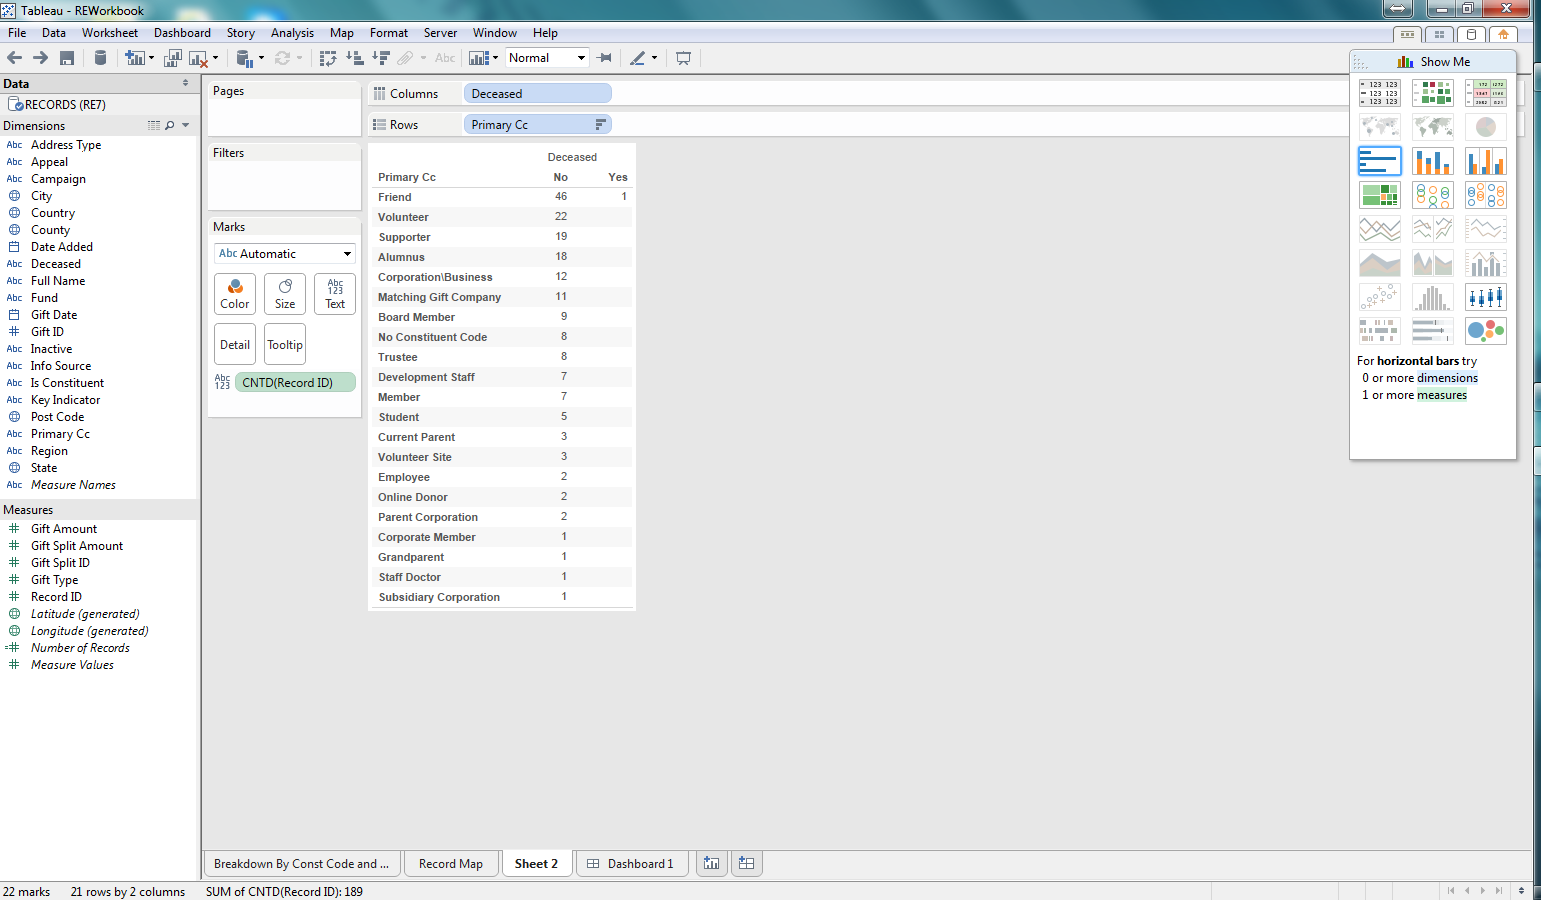
Change 0 and -1 Deceased values to No and Yes
Now that we are reporting on the number of records marked as Deceased.  Now lets use another key bit of information to the Columns section: whether or not a record is Inactive.  This will allow us to see, for each Deceased record whether or not there are any records still marked as Active, which seems to be at odds.

Adding Inactive RE dimension to the report
As I begin thinking about visualizing the data in the worksheet I realized that I should have flipped what is in the Columns and Rows section.  Thankfully Tableau has a button that does this automatically.  Wow, that was easy and a nifty little feature.  Well, you might be saying that all good visualization tools should do that, and you would be right; but Tableau does have it so someone was  thinking about usability when they pushed for this feature.

Columns and Rows flipped at the click of a button

Now that we have some data, lets begin exploring visualization.  I am selecting a bar graph first.  We are then able to quickly see, based on the length of the bars which constituent codes are Active/Inactive and Deceased/Not Deceased.

Bar graph for the count of records per constituent code that are Active/Deceased

Next lets use a Treemap.  This is another way to quickly see how the various counts for each constituent code, deceased, and inactive combination relates to the total.  This makes it easy to see not only which combinations have the highest counts, but the proportion against the total number of records.  Pretty cool.

Treemap for the demographic data

After considering these first two options, I decided to go back to the bar graph.  I thought it might be useful to add some color so that I can see what the Information Source for the preferred address for each of the combinations of demographics in the bar graph.  I can quickly see that most of my constituents don't have an Information Source recorded.  This would be concerning to me as I likely want to be able to see where our constituents are coming from and how we are acquiring this information so that I can identify how trustworthy that information may be. Pretty impactful and pretty easy to do as well.

Bar Graph now with color coding for Information Source for preferred address

In this series we focused on giving Tableau a test drive on reporting against some Raiser's Edge data.  I focused on demographic data for our records (constituents and relationships).  What I found was how easy it was to use the Tableau Desktop software to build worksheets and dashboards from a quick test drive.

In order for someone to use Tableau it would like require a pretty technical resource that can build some backend tools such as database views, to allow for the dynamic reporting that your organization may require.  But once that is in place, developing the actual worksheets and dashboards was pretty intuitive.  A savvy person could come up to speed with the basic ins and outs of Tableau in a day or two.  All in all, I think Tableau could be valuable for the non-profit community to use as a reporting tool for The Raiser's Edge.

Wednesday, October 22, 2014

Tableau Test Drive for Raiser's Edge Reporting - Worksheet Map

This is part IV in our series of looking at Tableau as our RE reporting solution.  You can see the other posts in the links below:
Part I - Installing Tableau
Part II - Connecting To RE and Planning our Dashboards
Part III - Our First Worksheet

In this installment we will now create a map showing where our constituents are located.  The first step is to create a new worksheet in Tableau.  After doing that we selected the map "chart" type to display our data.  We have selected State as our point of departure for  map information and again the count of records.  This map already begins to tell us a pretty compelling story in a very cool way:  most of our records are on the east coast with our biggest concentration in the southeast, specifically South Carolina.  But that is no surprise for our Raiser's Edge users who log into and play around with the sample database (the source of our data for this example).

Simple map of our Raiser's Edge records and relative number per state

Now that we have our map we can do some interesting things to "spice it up" as my wife likes to say.  So I brought over the primary constituent code dimension field into the Color section and the map becomes richer.  Now we can see colors associated with each state, telling us which constituent codes exist in the state on the map and their relative numbers.  Pretty cool.

Constituent Codes now showing up in each state

After taking a look at the map, I thought the size of the circles on each state was pretty small and difficult to read.  So I adjusted the size of the circles for the number of records for each state and the map now becomes a little easier to read.

Map after adjusting the size of the circles showing the number of records

Your map could be busy and you might want to add additional filters, such as for state, or other dimension fields.  My dataset is including all of the records in RE currently (constituents and non-constituents, aka individual relationships not linked to constituents).  So I am going to add a new filter to show the results for constituents only (Is Constituent = -1).

After adding the filter, the data is adjusted to show only constituents


There we have it, now we have a map of a breakdown of our constituents, based on constituent code and where they are located.  We could make this more specific and do some dynamic stuff like selecting a constituent code to show the results for a specific segment of our constituents, based on constituent code.

Monday, October 6, 2014

Tableau Test Drive for Raiser's Edge Reporting - The First Worksheet

This is part III in our series of looking at Tableau as our RE reporting solution.  You can see the other posts in the links below:
Part I - Installing Tableau
Part II - Connecting To RE and Planning our Dashboards

Now that we are connected to The Raiser's Edge with Tableau and have a dataset to work with in our workbook, lets focus on building out some of these reports.  Lets choose to focus on the report that breaks down the number of records by their Primary Constituent Code and where they are located.

First, lets select to create a new worksheet.  Now we are presented with an environment to be able to configure our worksheet to communicate a story about our data.  We can see that we have a list of fields (dimensions and measures) by which to slice and dice our data.  We can select different types of visualizations (charts, etc.) easily with the click of a mouse.  All this can be created with a pretty slick drag-and-drop functionality embedded in the software.

Our first worksheet 's"development" environment

Now that we have our worksheet development environment ready to go, lets play around with some configurations.  So we said that we want to report on the number of records by primary constituent code.  So the first step is lets include the measure of "Record ID".  With the selection of this measure we need to be sure that we configure it to count the number of Records.  If we had selected something like summary instead our numbers would be off as it would add up the actual IDs, not count them to get a record count.  I dropped the count of Record IDs into the row section.  I want my counts to be in a vertical format, not horizontal.  If I wanted them to go from left-to-right (horizontal) I would have dropped this measure into the Columns section.

Added the count of Record IDs as my measure

As we noted in our initial goal, we want to see where these records are located.  Lets start at Country to see where we can get a breakdown of the number of records based on Country.  To do this I drag the Country column to the Columns section above our graph.  Another note is that I have selected a bar graph to represent this data.  After dropping this Country column, you can see that we have a list of 3 countries (really 2 as some records have a "null" country meaning that there is not a Country value in this field on the preferred address) where our records are located.  From this graph we can easily see that most of our records are located in the United States.  Alone, this could be valuable information if all someone cared about was the Country.

We now have Country from the preferred address added to our worksheet
We also mentioned that we wanted to see where our records are located broken down by primary constituent code.  Our view contained the primary constituent code, which is the first constituent code in the list on the Bio 2 tab of a constituent record.  We dragged our Primary CC (Constituent Code) dimension field to the rows section.  And bam, we now have, across rows, each of our constituent codes and we can see where each of the records are, per constituent code.  Really easy.


We then took it a couple more steps farther.  We added the Region dimension to the Columns section and now we can see the Country and Region for our records per primary constituent code.  Finally, I wanted to add another bit of information in a different way than column or row.  So I dragged the State dimension to the Color section.  What we are then presented with is a color coding, within the chart of our states and the corresponding number of records per primary constituent code, country, and region, as well as state now.

If we had a significant number of records, which most RE customers are going to have, and not this small sample database, this worksheet chart/graph would really come to life.  This one looks a bit empty but it conveys a heck of a lot of information and we were able to do it very easily.


Something that this chart quickly points out is that most of our records don't have a region.  If region is important then perhaps I want to duplicate the report and add state so I can begin to see which states have a null region.  This allows me to visually begin to recognize how I might need to update my data so I can accurately report on Region, but also perhaps fix a process or system integration that is populating this region column.  Maybe I need to create a new process to "automagically" populate this field in the Raiser's Edge.

We could continue to extend this worksheet in multiple ways. The view from RE pulls all records, not just constituents.  So we could add a filter to have the user select to show all records, or just constituent records.  We could also add a filter for country to only show the US or any of the other geographic dimension fields that we have.

The point is that we built a potentially powerful worksheet/chart/report in a matter of minutes and it was all really easy to do.  We can create this type of analysis on nearly any type of information in The Raiser's Edge.

Wednesday, August 27, 2014

Tableau Test Drive for Raiser's Edge Reporting - Connecting to RE and the Planning

Now that we have Tableau Desktop installed, it is time to finish some basic setup, which includes establishing a new connection to The Raiser's Edge so that we can begin actually creating our dashboards and reports.  But to establish our connection we have to do something else:  Figure out what it is we actually want to report on.

To keep it pretty simple, I decided that I would create some dashboards and reports based on basic constituent demographics; stuff like preferred address details, primary constituent code, whether they were deceased, inactive, or an individual vs. organization, etc.  Then I said,what might I want to see and I spent about 5 minutes sketching out on a plain sheet of paper some demographic dashboard components (see the image below).  I recommend that you spend more time if you were planning your own.

My rough (very rough) sketch of the dashboards I wanted

Once that I established some rough estimate of what my dashboard and reports might look like, I then had to figure out how I was going to get that information.  As most of you know, getting info from The Raiser's Edge can, at times, be a bit complex.  So I knew I wanted preferred address.  I could have chosen all addresses but figured it made sense to keep it simple and only get the preferred address.  Then I decided that I wanted constituent codes, but again I decided I only wanted the primary constituent code (the one that is at the top of the list on the records Bio 2 tab).  And finally, some information from the record itself (deceased, full_name, etc.).

Now that I established what I am pulling from the database, I then had to figure out how I was actually going to get that info.  There were several ways to do it.  I could create a view in the actual Raiser's Edge database that pulls all of that together, then in Tableau I just pull the info from the view.  I could write my own custom SQL in Tableau (which is essentially writing the same SQL for the view option above).  And finally pull in all of the tables into Tableau and try to do some fancy joining in the tool.  To be honest, based on what I am doing, I am not even sure if Tableau could have done that - but I am going to assume that it could, but I chose not to.  I went with option 1, create the database view:  it seemed the easiest to do at this time so that I could focus on the dashboards and workbooks in Tableau.

Some code of the view I created on the RE Database

So now lets create a new connection in Tableau to our view.  From the home page, select the "Connect to Data" link on the left sidebar.  Then you will see a list of native connections that Tableau supports.  You will select Microsoft SQL Server from the list connections.  This is pretty basic connection information, just as if you were connecting to the Raisers' Edge server instance that the RE database exists on via SQL Management Studio.  Enter your details and select "connect".

Connecting to SQL Server in Tableau

From there you will then select the Raiser's Edge database in the dropdown at the left.  Once you do so, all of the Raiser's Edge database tables and views, as well as stored procedures are loaded for your selection.  This may take a few minutes to load. Once loaded, you can then select the tables, views, etc. that you want by dragging them to the top box in the main part of the form.  This is where you can bring multiple tables or views over and create joins on them as I mentioned earlier if you like.  For my case, I have 1 database view already created that I selected.  I also decided to add some gift information to my view just in case I need it for other dashboards.


Connected to the Raiser's Edge and selected the view to use

Once you have selected the tables and views that you want, you can then customize the connection by changing the field names, changing the datatype, etc. in the grid at the bottom panel of the main section of the form (as seen in the screenshot below).  Once you have everything setup for the data you want to be used in your workbook, click on the "Go to Worksheet" link in the middle orange section of the form and you are ready to build your dashboards.

You can also choose to have this connection setup to use the Live data or to Extract the data into the Tableau "Fast Data Engine" which allows for offline reporting and doesn't affect the performance of your live Raiser's Edge database.  This will be an area that hopefully I can explore - pending how much time I have left in my trial.


Again, all in all, pretty straight-forward and pretty easy.  Tableau continues to be very user-friendly in terms of installation and getting setup.  I thought the real fun would start after my last post (and designing your dashboards is fun), but in the next post we will create our first worksheet/dashboard, or something:)

Other posts in our series can be found at:
Part I - Installing Tableau
Part III - Our First Worksheet

Tuesday, August 26, 2014

Tableau Test Drive for Raiser's Edge Reporting - Installing Tableau Desktop

With the advance in all of the BI and Analytics tools in the marketplace, I thought I would give one of the most popular a test drive:  Tableau.  Below are other posts in the series:
Part II - Connecting To RE and Planning our Dashboards
Part III - Our First Worksheet

Tableau has numerous offerings in their suite of products including Tableau Desktop, which appears to be the primary one you would 'develop' your dashboards and BI reports, Tableau Server and Tableau Online, which appear to be engines where your developed dashboards and reports can be published for consumption by others in your organization.

So lets see how easy it is to get started on Tableau Desktop.  The first step is going to the Tableau website and requesting a download of Tableau Desktop:  easy.  You can go to Tableau Desktop and click on the Try It Free link to start your download.

The Tableau Desktop webpage with the Try It Free link

The size of the download was only a little over 100 mb, so not too big.  Once you have downloaded the software, just go find the setup executable on your hard drive and double click on it. The Windows installer is launched and you get a rather simple wizard.  The first screen just allows you to view the License Agreement and to provide some minimal customization of the product.


After clicking the "Install' button, you get the typical "Installing" wizard form with a status label and progress bar.  It only takes a minute or two for the actual installation to take place.

Once the installer is completed, Tableau is launched and you can start your free trial, 'start trial later' (which I recommend if you know you can't start playing around with the tool immediately so you don't waste valuable days of your trial), or activate your product.


Wow, that was easy.  Installing Tableau Desktop was that easy.  Now comes the more difficult, and much more fun, part - creating BI and Analytics dashboards and reports.  So lets give it a spin and see how it performs and the cool features it may have.

When you first start your trial, Tableau was nice enough to have some sample "workbooks" which appear to be their "projects" that you create your dashboards and reports in.  I think these samples are actually pretty good.  In addition, there are valuable links to training videos that you can watch, which are pretty darn good as well.  

Sample workbook that  comes with Tableau Desktop
All in all, a pretty positive first impression from Tableau.  I did initially install on one of my laptops running Windows 8.1 and it would crash (the blue screen of death) due to various issues, mainly memory issues even though I have enough.  My Windows 7 laptop (ironically with less memory than the Windows 8.1) had no issues whatsoever.

Up next, lets plan out our first workbook and get connected to RE.