Showing posts with label The Raiser's Edge. Show all posts

Thursday, October 23, 2014

Tableau Test Drive for Raiser's Edge Reporting - A Bit of a Deeper Dive into Demographic Reporting

In the final post in this little series, I am taking a deeper dive into reporting on other demographics using Tableau.  You can check out the other posts in this series below:

Part I - Installing Tableau
Part II - Connecting To RE and Planning our Dashboards
Part III - Our First Worksheet
Part IV - Worksheet Map

As I mention above, this post will focus on taking more demographic information from The Raiser's Edge, such as Deceased or Inactive, and exploring how we might report on this information in Tableau.  First we are creating a new worksheet.  We drag and drop the Deceased dimension into the Columns section and Primary CC (Constituent Code) into the Rows section.  Then we drag the Count of Record IDs into the table to report on the number of records.  Great, we can see which constituent codes are marked as Deceased (-1) or Not Deceased (0).  This could be valuable information if we saw that we had some key constituent code with a record marked as deceased.

Basic worksheet showing deceased/not deceased count by constituent code

Well, for a non-technical person have Deceased values of 0 or -1 is not very user-friendly.  But these values are what is stored in The Raiser's Edge database.  Tableau offers the capability to change how this is presented.  I have changed these values to No or Yes, which to a "business" user is much easier to understand.

Change 0 and -1 Deceased values to No and Yes
Now that we are reporting on the number of records marked as Deceased.  Now lets use another key bit of information to the Columns section: whether or not a record is Inactive.  This will allow us to see, for each Deceased record whether or not there are any records still marked as Active, which seems to be at odds.

Adding Inactive RE dimension to the report
As I begin thinking about visualizing the data in the worksheet I realized that I should have flipped what is in the Columns and Rows section.  Thankfully Tableau has a button that does this automatically.  Wow, that was easy and a nifty little feature.  Well, you might be saying that all good visualization tools should do that, and you would be right; but Tableau does have it so someone was  thinking about usability when they pushed for this feature.

Columns and Rows flipped at the click of a button

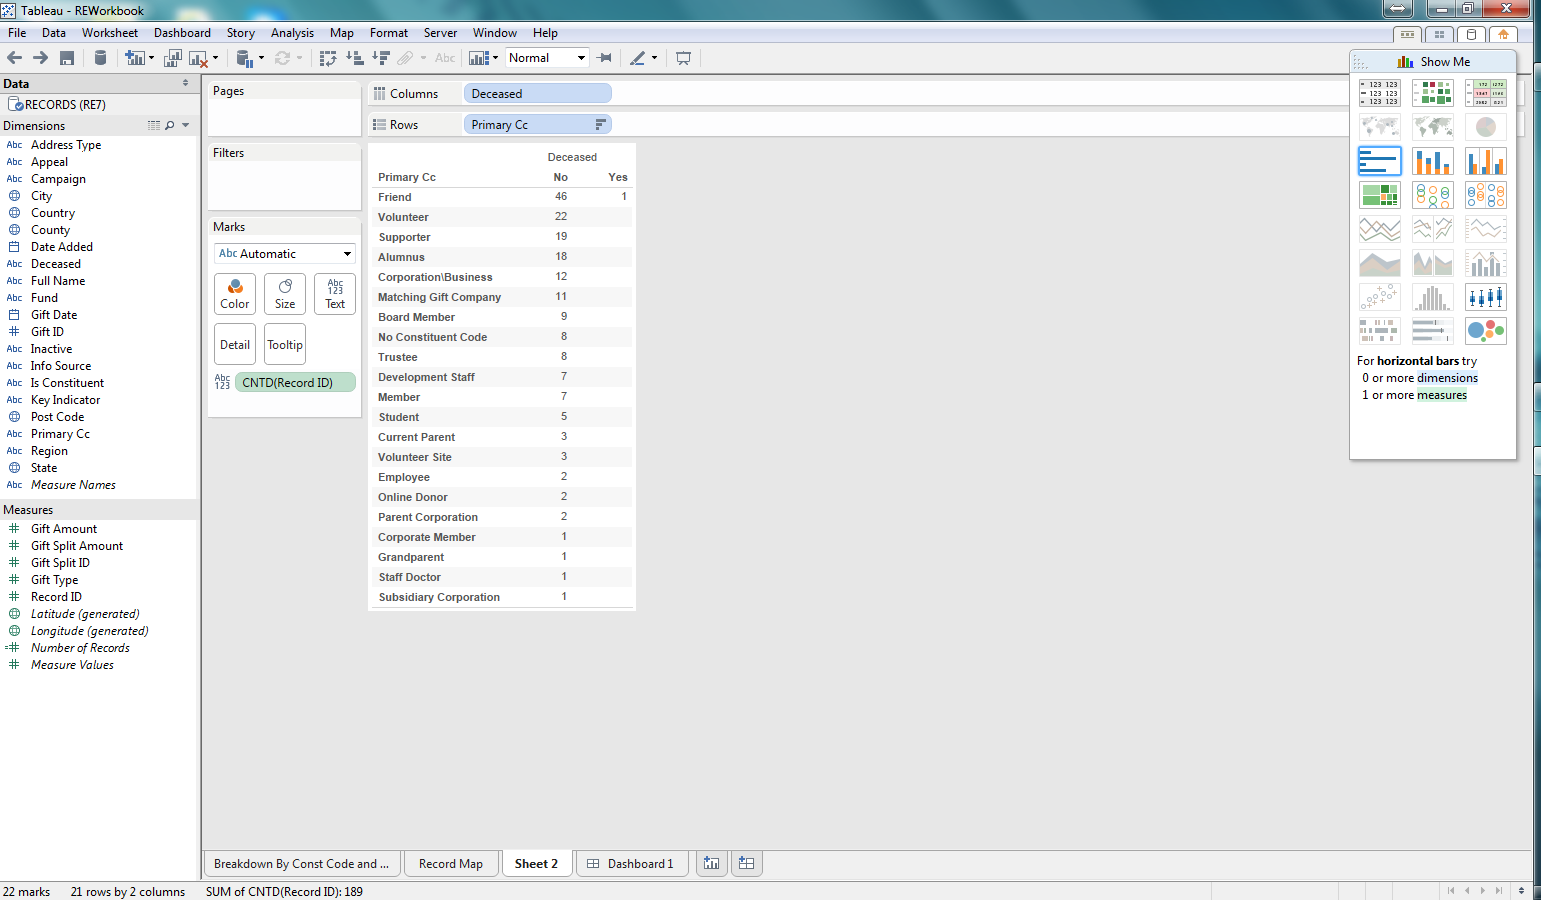
Now that we have some data, lets begin exploring visualization.  I am selecting a bar graph first.  We are then able to quickly see, based on the length of the bars which constituent codes are Active/Inactive and Deceased/Not Deceased.

Bar graph for the count of records per constituent code that are Active/Deceased

Next lets use a Treemap.  This is another way to quickly see how the various counts for each constituent code, deceased, and inactive combination relates to the total.  This makes it easy to see not only which combinations have the highest counts, but the proportion against the total number of records.  Pretty cool.

Treemap for the demographic data

After considering these first two options, I decided to go back to the bar graph.  I thought it might be useful to add some color so that I can see what the Information Source for the preferred address for each of the combinations of demographics in the bar graph.  I can quickly see that most of my constituents don't have an Information Source recorded.  This would be concerning to me as I likely want to be able to see where our constituents are coming from and how we are acquiring this information so that I can identify how trustworthy that information may be. Pretty impactful and pretty easy to do as well.

Bar Graph now with color coding for Information Source for preferred address

In this series we focused on giving Tableau a test drive on reporting against some Raiser's Edge data.  I focused on demographic data for our records (constituents and relationships).  What I found was how easy it was to use the Tableau Desktop software to build worksheets and dashboards from a quick test drive.

In order for someone to use Tableau it would like require a pretty technical resource that can build some backend tools such as database views, to allow for the dynamic reporting that your organization may require.  But once that is in place, developing the actual worksheets and dashboards was pretty intuitive.  A savvy person could come up to speed with the basic ins and outs of Tableau in a day or two.  All in all, I think Tableau could be valuable for the non-profit community to use as a reporting tool for The Raiser's Edge.

Monday, October 6, 2014

Tableau Test Drive for Raiser's Edge Reporting - The First Worksheet

This is part III in our series of looking at Tableau as our RE reporting solution.  You can see the other posts in the links below:
Part I - Installing Tableau
Part II - Connecting To RE and Planning our Dashboards

Now that we are connected to The Raiser's Edge with Tableau and have a dataset to work with in our workbook, lets focus on building out some of these reports.  Lets choose to focus on the report that breaks down the number of records by their Primary Constituent Code and where they are located.

First, lets select to create a new worksheet.  Now we are presented with an environment to be able to configure our worksheet to communicate a story about our data.  We can see that we have a list of fields (dimensions and measures) by which to slice and dice our data.  We can select different types of visualizations (charts, etc.) easily with the click of a mouse.  All this can be created with a pretty slick drag-and-drop functionality embedded in the software.

Our first worksheet 's"development" environment

Now that we have our worksheet development environment ready to go, lets play around with some configurations.  So we said that we want to report on the number of records by primary constituent code.  So the first step is lets include the measure of "Record ID".  With the selection of this measure we need to be sure that we configure it to count the number of Records.  If we had selected something like summary instead our numbers would be off as it would add up the actual IDs, not count them to get a record count.  I dropped the count of Record IDs into the row section.  I want my counts to be in a vertical format, not horizontal.  If I wanted them to go from left-to-right (horizontal) I would have dropped this measure into the Columns section.

Added the count of Record IDs as my measure

As we noted in our initial goal, we want to see where these records are located.  Lets start at Country to see where we can get a breakdown of the number of records based on Country.  To do this I drag the Country column to the Columns section above our graph.  Another note is that I have selected a bar graph to represent this data.  After dropping this Country column, you can see that we have a list of 3 countries (really 2 as some records have a "null" country meaning that there is not a Country value in this field on the preferred address) where our records are located.  From this graph we can easily see that most of our records are located in the United States.  Alone, this could be valuable information if all someone cared about was the Country.

We now have Country from the preferred address added to our worksheet
We also mentioned that we wanted to see where our records are located broken down by primary constituent code.  Our view contained the primary constituent code, which is the first constituent code in the list on the Bio 2 tab of a constituent record.  We dragged our Primary CC (Constituent Code) dimension field to the rows section.  And bam, we now have, across rows, each of our constituent codes and we can see where each of the records are, per constituent code.  Really easy.


We then took it a couple more steps farther.  We added the Region dimension to the Columns section and now we can see the Country and Region for our records per primary constituent code.  Finally, I wanted to add another bit of information in a different way than column or row.  So I dragged the State dimension to the Color section.  What we are then presented with is a color coding, within the chart of our states and the corresponding number of records per primary constituent code, country, and region, as well as state now.

If we had a significant number of records, which most RE customers are going to have, and not this small sample database, this worksheet chart/graph would really come to life.  This one looks a bit empty but it conveys a heck of a lot of information and we were able to do it very easily.


Something that this chart quickly points out is that most of our records don't have a region.  If region is important then perhaps I want to duplicate the report and add state so I can begin to see which states have a null region.  This allows me to visually begin to recognize how I might need to update my data so I can accurately report on Region, but also perhaps fix a process or system integration that is populating this region column.  Maybe I need to create a new process to "automagically" populate this field in the Raiser's Edge.

We could continue to extend this worksheet in multiple ways. The view from RE pulls all records, not just constituents.  So we could add a filter to have the user select to show all records, or just constituent records.  We could also add a filter for country to only show the US or any of the other geographic dimension fields that we have.

The point is that we built a potentially powerful worksheet/chart/report in a matter of minutes and it was all really easy to do.  We can create this type of analysis on nearly any type of information in The Raiser's Edge.

Friday, August 1, 2014

Reporting on Raiser's Edge Recurring Gifts with the RE Recurring Gift Reporter Excel Add-In. It is so easy!

Hi everyone.  Thanks again for coming to my blog.  Recently I posted about different ways to report on The Raiser's Edge.  Then I took a deeper dive into Microsoft Excel reporting.  In this edition I am going even further, focusing on one example of a pretty cool way to integrate The Raiser’s Edge with Microsoft Excel.  I am thinking that this will be one post to highlight what I did but I could see it turn into multiple posts.

Awhile back, I saw a post on some forum about how to report on recurring gifts.  This got me to thinking about one of the challenges of reporting on recurring gifts: that it is difficult to get a report of future recurring gift installments (or future revenue from recurring gifts).  At least I don’t know of a good way to get at this info right now.  And I would be willing to bet that many organizations would like to be able to see what their expected future revenues are, and particularly for future recurring gift installments.  Having this information could result in better future planning of future fundraising success.

OK, lets cut to the chase:  What did I do?   I used Visual Studio to create a Microsoft Excel Add-In which can be installed on a pc or laptop running The Raiser’s Edge and Microsoft Excel  (disclaimer versions must be compliant; e.g. this will not run on Excel 2007 as it was built for 2010 and higher;  however also note that it has not been tested with Excel 2013 yet).  This Excel Add-In hooks into The Raiser’s Edge API, prompting the user for a RE Login if they are not already logged in and then generates the raw data, along with reports and charts (if selected) automagically in Excel. 

Lets circle back around and discuss what this stuff looks like and how it behaves.   After the Add-In is installed, the next time you open Microsoft Excel 2010 you should see a new ribbon available named RE Recurring Gift Reporter. 


Once Excel opens and you navigate to the RE Recurring Gift Reporter ribbon, you are presented with several options.  Lets take a look at the View Future Recurring Gift Installments, which is really a forecasting report.  Clicking on the button reveals the following form:


As you can see it is pretty straight-forward.  But that is the point.  Keep it simple and if anyone wants more features they can easily be added to the form.  But lets take a closer look, the user can select to create pivot tables and charts or not.  If no pivot tables are selected, then just the future recurring gift installments are exported in raw data format.  In addition, the user can select an "End Date" for future installments.  As a result however far in the future you want to report on, you can.

After you click the "Create" button then what you selected will be exported into Excel, resulting in something like the worksheet below:


Again, it really is that easy!!

The second large button, View Recurring Gifts, functions just the same as the other button, but provides reports on the recurring gifts themselves, not future installments.  When those reports are run it may look like the spreadsheet below:


It is really that easy.  Open Excel, select a report to run, click the settings, (possibly log into RE), and the report is generated.  You can run it multiple times, day after day and begin to have some intelligence about your future revenues.

A few other notes about how the Add-In works:

It exports the raw data into a spreadsheet and creates a named range from which it creates reports.  You can run it to export only the raw data and you then work with the data yourself.  Or you could select it to create the pivot tables and charts, giving yourself a starting point for how to use the raw data.

In the event that your database has a large number of recurring donations and you select a very large time period to report on, it may take a while to load the data into the spreadsheet.  This could be improved and function slightly different should you need that capability. 

Only a subset of the available columns in RE are used in this Add-In.  I focused on the core ones for now.  For a reasonable fee I can customize the Add-In for your needs, including adding more columns available in the Add-In.

 It pulls gift split information, so it can report on campaign, funds, and appeals for split gifts.  In addition, the system record id for the gift is included so that you can group gift information together to report on total gift information (e.g. the total amount for the gift not just the split amount). 
     
So what you say?  I say great question, or is that really a statement.   I would turn it back around and ask you the following questions:
     1.  Can you tell me how much expected future revenue you have coming in per month from recurring gifts over the next X number of years?
     2.  Can you tell me how much money you have coming in for a specific campaign, fund, or appeal over the next X number of years?
     3.  Can you tell me how much money you have coming in for a specific primary constituency (from the constituent record) over the next x number of years?
     4.  Can you tell me how much money you have coming in for a specific fund and gift constituency (from the recurring gifts) over the next x number of years?
     5.   If you can do any of the above, how long will it take you to pull that information?

I think these are pretty great questions to ask.  We can do 1 through 4 plus produce all other kinds of reports slicing and dicing future recurring gift installments and we can do it in a matter of seconds, maybe minutes depending on how much data you have.  I think that is pretty darn awesome. 

Guess what else?  Your Executive Director, or Development Director, could get this information without having to ask their Database Manager to “produce the report and send it to me”.   It is that easy to use.  Plus you now have the data in a workable format and you can create a lot of other reports from the data presented to you.  This data is not static, like a Crystal Report would be.  You can trust the data as it is coming directly from The Raiser’s Edge (assuming that is that you require your employees to enter this information into The Raiser’s Edge).

OK – Now the sales pitch.   I know, I know, but it is necessary for me to continue providing these great tools for non-profits.  Go check it out and request a download to see for yourself.  Even better, we can customize it further to tailor it to what you need at a great rate.   We can even do something similar with other Raiser’s Edge data or  even data that exists in other databases.  Stop struggling with getting your data into a format that is difficult to use and extend, or takes forever to produce.  Reach out to us and we can tell you more about the product and discuss how easy it would be to make it even better for your needs.

Thursday, July 31, 2014

Leverage a tool most already have for RE Reporting: Microsoft Excel

In an earlier post, I laid out some options, other than Crystal Reports, of how one might report on The Raiser's Edge.  In this post I will take a deeper dive into one of those options: Microsoft Excel.

On the surface many think that Microsoft Excel is not the best reporting tool.  Some would put forth that it is great for informal,one-off, individual reporting and not for enterprise-wide consumption.   And to a certain degree they are right.  However, from a non-profit perspective where limited budgets, limited resources, and lack of technical options and even technical know-how are prevalent, Microsoft Excel can be a powerful tool.

First, lets consider why Microsoft Excel can be a great reporting tool:

1.  People know it (sorta) already - Many people are already familiar with it and can navigate through the application fairly easily.  Some of the ways that I put forth in this post about using Microsoft Excel as a reporting tool are beyond the skills of many users, but because these users are already familiar with Microsoft Excel, the navigation of the dashboards and reports that are produced are still familiar to that end-user.
2.  Good automation and integration capabilities - Microsoft has done a pretty good job of creating features that allow for easy integration with other databases, workbooks, or data sources.  Through VBA (Visual Basic for Applications), Macros, Add-Ins, SharePoint integration, and other data integration capabilities, cumbersome, time-intensive, even very difficult or impossible tasks can be accomplished at the click of a button.
3.  It travels well - When offline, a database cannot be accessed.  A website cannot be accessed.  But if that data has been placed in an Excel spreadsheet, it can go where the end-user goes.
4.  Rich interactive and drill-down ability - When the "raw-data" has been placed in a workbook, the reports, charts, and pivot tables from this data come alive, allowing an end-user to drill-down into the details from summarized dashboards.

Next lets look at the challenges of using Microsoft Excel:

1.  Technical Competencies Needed - In order to really take advantage of Microsoft Excel, it will likely require someone that has a specific technical skillset that you may not have in-house.  But that is likely true for any application that you are going to use to report on The Raiser's Edge.
2.  Stale Data -  Data can become stale and can tell a story from an obsolete point-in-time if not used with caution, or implemented dynamically.  So these Excel reports must be understood in the context of when they were created or they must be implemented in such a way that they can be updated or refreshed on-demand.
3.  Software Limitations - There are limitations on the software itself, e.g. row limits in a workbook.  In addition, the delivery of the workbooks can be challenging - email, network drive, SharePoint library, etc. all present problems because the Excel "file" could be quite large.  But again, this is where implementation and design makes a huge difference:  allow a user to be able to create the report on-demand.

Powerful features of Microsoft Excel:

1.  Get External Data - First of all, Microsoft Excel allows the end-user to connect to multiple different types of data sources and import this data into an Excel spreadsheet.  Microsoft Access, Web Services, XML Files, SQL Server, ODBC (Microsoft Query), and other sources can all have data pulled into an Excel spreadsheet, including The Raiser's Edge.  This will often require some level of technical  competency to be able to use and likely can only be used by those with those technical competencies.
2.  VBA (Visual Basic for Applications) - This is where it starts to get interesting.  An Excel Macro-Enabled Workbook (.xlsm file) can have VBA code embedded which allows for all kinds of automation procedures.  This is the first capability that can really improve efficiences and reduce the time it takes to generate a report.
3.  Add-Ins - Microsoft Visual Studio can be used to create Excel Add-Ins which allow for application level automation.  Whereas a VBA macro is related to a specific workbook (and the code goes with that workbook), an Add-In is available to all workbooks.  Think in terms of writing code that automates a task and the task is executed by a user clicking a button on the Excel ribbon (just as if someone was clicking the Sort button).
4. Pivot Tables and Charts - Pivot tables and charts are the actual implementations of "reports".  They allow for great analysis and visualization of data.  Pie-charts, line-graphs, trends, etc. can all be visualized.  In addition, these are living, breathing reports.  When a the pivot table is changed or refreshed, the chart changes with the pivot table.  Expanding and Collapsing off the analysis of the data is available - all pretty power stuff.

There are more features and maybe I will highlight them in follow up posts.

Finally, some practical examples/ideas for Microsoft Excel reporting of The Raiser's Edge:

1. KPI and metrics - Perhaps you have someone create some VBA code or an Add-In that queries a specific database and provides "results" in the form of KPIs (Key Performance Indicators) and metrics.  These KPIs can either be business-driven (e.g. sales/revenue metrics) or data quality driven (e.g. # of records missing an address).  This could then be extended to create charts and graphs showing the trend of the KPI over time.  For example, you can see how your data quality improves over time if the KPIs and metrics are recorded and saved each time the tool is run.  You can then evaluate your strategy to improve data quality to see if it is actually working.
2. Improve those manually created excel spreadsheets - Think of a situation where you have to combine  multiple spreadsheets and then do a lot of copy and pasting of data from one workbook to another.  Then you need to get a report from another database and enter that data.  It takes forever.  If you are doing the same thing over and over, every time, then let someone write some VBA code to allow this to be automated for you.  This saves from human error as well.
3. Report on future/expected revenue (recurring gifts)- Perhaps you have a situation where you want to plan future campaigns, or other revenue generating activities, and but you want to see where expected future revenue will be impacting your organization.  An add-in can be created which, at the click of a button, can connect with the database and extract this information, creating pivot tables and charts, slicing and dicing this information giving you the ability to see where this future revenue will be recorded.

Update - I have created a Microsoft Excel Add-In that does just that.  You can go to the blog post with details about the Microsoft Add-In and see more information about it and how it works.

4. Report on solicitor activity/details - Imagine you open Excel, go to a new ribbon, and click a button.  You are automatically logged into RE, and prompted to select from a list of solicitors.  Once you select the solicitor you want a report on, you get a new spreadsheet showing lots of valuable information about the performance of the solicitor:  gift summary information, action summary, proposal summary, etc.  No queries, no exports, no complicated crystal reports that doesn't give you all you want or need.  That is the beauty, you get everything you want to see!
5. Pull data from multiple databases into 1  report - Imagine you've got Raiser's Edge data, as well as data from other third party vendors, and this data has not been pulled together in one database.  You could have a report written where the data is pulled together from these disparate data sources and organized in such a way that you get the visibility across these sources.  But this also begs the question  of why aren't you pulling this data together in a data warehouse or The Raiser's Edge itself before doing the reporting?

Good luck in your use of Microsoft Excel. Let us know if we can help you out or talk you through how you might leverage Excel as a better reporting platform for your organization.

Sunday, July 27, 2014

RE Users: Crystal Reports is not your only option!

Something that drives me crazy for The Raiser's Edge community is the perception that Crystal Reports is the best way to provide reports (outside of the built-in reports and dashboards) because that is what comes with The Raiser's Edge.  The Raiser's Edge is a SQL-based database and as a result there are many alternatives to reporting. Below are a few options, separate from Crystal Reports and the built-in RE Reports.  This post is just scratching the surface of what is possible.  Not covered are topics such as static vs dynamic reports, automation, integration with other data sources, KPIs and metrics, and even automatic notifications.


Microsoft Excel

One technology that nearly everyone uses, but many don't have a "super-user" grasp of, is Microsoft Excel.  Once data lands in Excel it is amazing what people can do with it.  And I would be willing to bet that many RE, non-techie users, can at least get the data into Excel via Export or Query.  Once the data is in Excel, developers, or power-users can then get very creative and write VBA macros, or leverage Pivot Tables and Charts, and use conditional formatting among other things to generate reports and dashboards that can easily be shared.  Dynamic filtering can be implemented to let users get a different picture of the data.

In addition,  through add-ins and macros, these reports can be automated such that executives and directors, or even other users, can pull the data at the click of a button, without having to log into RE and develop queries and exports.  Heck, once it is in Excel, these reports can be posted onto SharePoint and rich reports displayed on web pages in SharePoint.

Update - Go check out this Microsoft Add-In which reports on The Raiser's Edge recurring gifts that I have created to show you how you can leverage Microsoft Excel a bit better.

Microsoft Access

Another application in the Microsoft Office suite of products is Microsoft Access. Data can be imported or linked through Access and then presented in a way that can be reported on.  Queries can be written, views created, forms generated, and data can even be taken offline for times when disconnection to The Raiser's Edge ensues.  When using Access, one must be careful to not update data directly in the SQL Server backend as the database could be corrupted with "bad data" that does not adhere to The Raiser's Edge front-end application. 

SQL Server Reporting Services (SSRS)

With SQL Server Reporting Services, you can create interactive, tabular, graphical, or free-form reports from relational, multidimensional, or XML-based data sources. Reports can include rich data visualization, including charts, and maps. You can publish reports, schedule report processing, or access reports on-demand. You can select from a variety of viewing formats, export reports to other applications such as Microsoft Excel, and subscribe to published reports. The reports that you create can be viewed over a Web-based connection or as part of a Microsoft Windows application or SharePoint site. You can also create data alerts on reports published to a SharePoint site and receive email messages when report data changes.


SharePoint Web Parts

SharePoint may be a tool that many of you are already using.  It is a great way to organize content such as documents and list-type information as well as enable knowledge sharing and collaboration.  However, when one views it truly as a knowledge sharing tool, letting it provide dashboards and reports to those users that don't need access to The Raiser's Edge application, but rely on reports generated from it can be opportunity.  Web pages can be created with custom web parts, or data view web parts, that pull information from The Raiser's Edge via SQL and display these reports and dashboards within the pages themselves.  This even allows for information sharing across geographic locations, or for those people that may travel, since the content is served up via web pages.drill-down.  SharePoint presents a great opportunity to share your Raiser's Edge data.

Check out my post on displaying a webpart in SharePoint reporting on Raiser's Edge data as an example.


Custom Application Development

Having a software developer create a dashboard application, or an application that contains dashboards, is a great way to have your Raiser's Edge data tell you a story.  A Dashboard application must serve another purpose as well to be worth the investment.  Maybe these reports need to come alive and offer drill-down capabilities, such as our Raiser's Edge Financial Dashboard.  Or maybe they have some further integration capabilities with the Raiser's Edge.  Even a Raiser's Edge plug-in could be created that is available from within The Raiser's Edge itself that provides additional reporting and dashboarding capabilities.  Whatever the extra requirements you have, custom application development can go a long way.

There are many other Business Intelligence (BI) and Analytics tools out there, such as Tableau, Spotfire and Logi, that can access a SQL Server database (which most Raiser's Edge customers use).  What I have presented to you is just a snippet of opportunities that many of you may already have in-house.  If you are hosted by Blackbaud then your options are severely limited.  There are other options out there should you want to explore those to allow you to improve your investment in The Raiser's Edge.  Should you want to explore one of these options or see what may be best for your organization to get more out of your Raiser's Edge investment you can go to our website for Tucamino Solutions and contact us via our website.

Thursday, June 20, 2013

Some Interesting Possibilities Displaying Raiser's Edge Reports and Dashboards in SharePoint

So you have invested in Microsoft SharePoint and you are trying to figure out how you can get the most bang for your buck.  Your organization also has purchased and implemented The Raiser's Edge.  You may be feeling that the reports in The Raiser's Edge are lacking, or that you don't have enough licenses to allow everyone in your organization to connect to The Raiser's Edge at the same time.  Perhaps you don't want to have to train all your end-users, especially those that only need reports anyway, on how to use The Raiser's Edge.

Well, you can leverage the SharePoint platform to display information from The Raiser's Edge via web pages.  It could be dashboards and other reports, lists of data, or even detailed information about your constituents, events, or other records in RE.  Imagine if you have users that need only read-only access: being able to have a web page in SharePoint where the user can enter filter or search criteria and view those constituents that meet the criteria along with details about those constituents, all without having to log into The Raiser's Edge.

Below are some of the ways that SharePoint can be leveraged to display this RE information, or any other information from any SQL database or other data sources:

ASP.NET Web Parts
Many ASP.NET web parts, such as the Grid View and Data List, available with SharePoint Designer, allow us to query and display data from different data sources in many types of formats, typically in a table or form layout. They can work with any data source that’s available in SharePoint Designer, like SQL Server, XML files, and more.  And with The Raiser's Edge being SQL-Server based, these web parts can be used to display this data. Another advantage is that it is easy to customize and considered "out-of-the-box"  and a "no-code" solution.  Check out this blog post where I use an ASP.NET to show a recent gift list from The Raiser's Edge.

Business Connectivity Services
The Business Connectivity Services allows SharePoint to connect to other systems, such as The Raiser's Edge, you already have, and work with them in various ways. A developer can configure the data connections to connect to The Raiser's Edge and import data into external content types, which can then be viewed in a SharePoint list.  What is great is this capability is native to SharePoint 2010 and 2013, however it can be a bit awkward at times, depending on what you might want to do.  In addition, it is meant to allow for data interaction (adding, editing, etc.) and not only for the consumption of data.  With The Raiser's Edge being a complex relational database model, it is advised that this feature not be utilized to update Raiser's Edge data, but to only view data.  Our first entry to show how BCS might be used is posted at the following link.

Excel Services
Excel Services provides the capability to display a named item from a Microsoft Excel workbook, such as a named range or chart, as a web part in a SharePoint web page.  This allows end users to build reports in Microsoft Excel and with developer assistance, display these for others to view as components in a web page.  A developer could even automate the creation of the Excel reports, the publication of the Excel workbook to SharePoint, and WHAM, all the reports are automagically updated.

SQL Server Reporting Services
SQL Server Reporting Services provides a full range of ready-to-use tools and services to help you create, deploy, and manage reports for your organization, as well as programming features that enable you to extend and customize your reporting functionality.  With Reporting Services, you can create interactive, tabular, graphical, or free-form reports from relational, multidimensional, or XML-based data sources. Reports can include rich data visualization, including charts, maps, and sparklines. You can publish reports, schedule report processing, or access reports on-demand. You can select from a variety of viewing formats, export reports to other applications such as Microsoft Excel, and subscribe to published reports. The reports that you create can be viewed over a Web-based connection or as part of a Microsoft Windows application or SharePoint site. You can also create data alerts on reports published to a SharePoint site and receive email messages when report data changes.

Visual Studio Custom Web Part
Visual Studio can be a powerful medium for creating components that can hook into SharePoint or The Raiser's Edge.  A custom web part that gives the developer more control over the visual presentation can be created with this development platform.  For example, a developer could create a visual web part that displays a chart based on some data from The Raiser's Edge.  This chart could be created by hooking into Google Charts to render the visual presentation of the chart.  I hope to create an example of this to show the power.  Parameters and Properties could be added to the web part to give further implemention options.  For examnple, one web part could allow the person deploying the web part on one page to display a pie chart for each Campaign, but on another the same web part could display the chart per Fund.  All in all, this is the most customizable option to creating that perfect set of web parts.

There are more options but these are a few of the highlights of possible ways to deploy Raiser's Edge reports and dashboards to SharePoint.  I hope to post an example for each of these in the coming months to give you detailed examples.  This type of reporting can be used for many other databases as well.  Contact us via email or go to our website to let us know how we can help you improve the way you work with The Raiser's Edge or Sharepoint.

Monday, June 17, 2013

The Raiser's Edge Financial Dashboard Part V - How to Extend It Further

OK, so we have picked apart the Tucamino Solutions Raiser's Edge Financial Dashboard application a bit.  Great, so what.  Well, you may download it and give it a try and say to yourself "This is the best reporting application ever for The Raiser's Edge!!!".  OK, probably not, but you may say "you know what, this is actually pretty cool and it shows great information, but I wish it could _____________".  Thats OK.  No application, report, or dashboard is perfect. 

What we have provided is a foundation for an application that can be used out of the box and provide great information.  However, it is also designed in a way that it can be extended very easily.  What do you mean by "extending" it further?  Well, that simply means that we have a core platform or baseline to add new functionality.  Here are some ways to add new functionality:

1.  Change the actual dashboard components.  Perhaps you want to look at Raiser's Edge gift trends over 5 years, or want to show a chart based on a Constituent's or Gift's constituent code. 
2.  Add new drill-down reports.  You may need additional detailed reports that we can add for you to drill-down into more detailed. Perhaps it deals with Pledges or Recurring Gifts, or even Proposals and Actions.
3.  Add filtering and other configuration options.  As mentioned in the posts, this dashboard component only focuses on cash gifts (cash, pay-cash, etc.), but perhaps you want stocks and gift-in-kind included.  In addition, maybe you want each user that uses the application to be able to filter based on other data (constituency, solicitors, etc.).
4.  Create a whole new application.  You may have a need for something completely different but want it in a similar format, displaying completely different information, or anything else you might think of.  Because we have a starting point, and we know The Raiser's Edge, we can quickly develop applications that you can use, minimizing the total cost to you because we have a head-start.

We offer discounts on customizing this application as we want to not only provide specific updates and new functionality for paying customers, but where we see the opportunity, we will include that new functionality in our FREE product for others to use.  We can't keep adding this functionality without your help.  We want to keep this product free for all.  So it is a win for the entire non-profit community when you use us for your Raiser's Edge customizations and other technology-related efforts.

Go check out our website to see what else we can do for you and even see what other products we might have.  At the very least go to our site and request your FREE download of our Raiser's Edge Financial Dashboard product and give it a spin and provide us some feedback.

Check out the other articles, coming soon, in our series:
The Raiser's Edge Financial Dashboard Part I - The Overview
The Raiser's Edge Financial Dashboard Part II - The Big Picture
The Raiser's Edge Financial Dashboard Part III - Drill-Down Analysis
The Raiser's Edge Financial Dashboard Part IV - True Integration with The Raiser's Edge

Tuesday, June 11, 2013

The Raiser's Edge Financial Dashboard Part IV - True Integration with The Raiser's Edge

Welcome back.  We are in our fourth blog post in the series on the Raiser's Edge Financial Dashboard.  We have looked at some of the specifics of the dashboard application, form the high-level home page, or "Big Picture" to the drill-down capabilities to get more information.  We touched on briefly in our last post about the capabilities to truly integrate with The Raiser's Edge.   Integration can mean many different things to different people.  What I mean by "true integration" with The Raiser's Edge is hooking into the Raiser's Edge API, commonly called the RE:API.

The Raiser's Edge Financial Dashboard is designed in a way that the user can connect via the RE:API, and get access to the built-in Raiser's Edge forms, etc. or the user can connect directly to the SQL Server database.  In order to take advantage of the integration as described in this post, the option to use the RE:API must be selected (as seen at the right).  A benefit to not selecting this option, and using the "Connect directly to the SQL Server database" option, is that a Raiser's Edge concurrent license is not used and thus other users can access The Raiser's via the RE application while other people are accessing and using the Raiser's Edge Financial Dashboard application.  A quick  disclaimer: those organizations hosted by Blackbaud will likely not be able to take advantage of this type of Raiser's Edge customization due to constraints with using Blackbaud hosting.  This will affect nearly all customized products that integrate with The Raiser's Edge as well.   

When the Raiser's Edge API option is selected, and the user clicks on the Raiser's Edge Financial Dashboard to launch the application, immediately the user begins to see how integration with the RE:API takes place.  They are presented with the standard login screens provided by the out-of-the-box RE application.  First there is the option to select the database to connect to and second is the username and password login form for that database selected, as seen at the left.  A user may only open the dashboard application and view the dashboards and reports when they have successfully authenticated with that database, all via the RE:API.

After successful login to The Raiser's Edge, the main dashboard page, as described in a previous posts comes up.  On the main dashboard page additionally functionality such as the drill-down capability to other reports and dashboards, as well as access to Raiser's Edge information shown in Raiser's Edge forms is available from the right-click menu on the dashboard components.  At the right is an example:  The FY Campaign Year-To-Date component allows a user to hover over a section of the chart for a specific campaign and then select to open the campaign with the out-of-the-box Raiser's Edge Campaign form.

After selecting to open the campaign from the right-click menu on the Campaign dashboard component, the out-of-the-box Raiser's Edge campaign form opens.  As seen at the left, this is the campaign form that a user sees when a campaign is opened from the Raiser's Edge application.  How cool is that?  Well, I think it is pretty powerful considering the user is not in The Raiser's Edge, but in another application.  The user can navigate this form just as they would normally, accessing other reports and links from this campaign record.


The tight integration to The Raiser's Edge does not stop at the main dashboard page.  When a user drills down into the dashboard application, eventually a user may look at a list of gifts.  This list contains some of the details for the gifts such as Gift Amount, Gift Date, Campaign(s), etc.  When one considers this specific set of information, opportunties arise for further integration with The Raiser's Edge.   As seen at the right, when the user right-clicks on a gift they may then open the gift or the constituent which gave the gift.  You could even have campaigns available, solicitors, or other links to detailed information in The Raiser's Edge.

When the user clicks on the "Open constituent <Constituent Name>" link, more magic happens.  The user is presented with the constituent form used in The Raiser's Edge application.  For those users of The Raiser's Edge, they know that the constituent form contains a wealth of information (much more than what is aggregated and summarized in the Financial Dashboard).  And when one considers that this type of functionality can be included in an application that resides outside of The Raiser's Edge, well, I would hope they would say "That is pretty cool stuff".  Now think about the possibilities of connecting The Raiser's Edge data to other data sources but providing this powerful linking capability.  The possibilities are endless.

If you want to get more information about the Tucamino Solution's Raiser's Edge Financial Dashboard application, go to the product page on our website.  You can find more products listed on our website as well..  You can request a download of the product, and many more, from our website.

Check out the other posts in our series at:
The Raiser's Edge Financial Dashboard Part I - The Overview
The Raiser's Edge Financial Dashboard Part II - The Big Picture
The Raiser's Edge Financial Dashboard Part III - Drill-Down Analysis
The Raiser's Edge Financial Dashboard Part IV - True Integration with The Raiser's Edge
The Raiser's Edge Financial Dashboard Part V - How to Extend It Further