Showing posts with label SQL Server Reporting Services. Show all posts

Sunday, July 27, 2014

RE Users: Crystal Reports is not your only option!

Something that drives me crazy for The Raiser's Edge community is the perception that Crystal Reports is the best way to provide reports (outside of the built-in reports and dashboards) because that is what comes with The Raiser's Edge.  The Raiser's Edge is a SQL-based database and as a result there are many alternatives to reporting. Below are a few options, separate from Crystal Reports and the built-in RE Reports.  This post is just scratching the surface of what is possible.  Not covered are topics such as static vs dynamic reports, automation, integration with other data sources, KPIs and metrics, and even automatic notifications.


Microsoft Excel

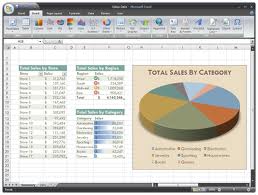
One technology that nearly everyone uses, but many don't have a "super-user" grasp of, is Microsoft Excel.  Once data lands in Excel it is amazing what people can do with it.  And I would be willing to bet that many RE, non-techie users, can at least get the data into Excel via Export or Query.  Once the data is in Excel, developers, or power-users can then get very creative and write VBA macros, or leverage Pivot Tables and Charts, and use conditional formatting among other things to generate reports and dashboards that can easily be shared.  Dynamic filtering can be implemented to let users get a different picture of the data.

In addition,  through add-ins and macros, these reports can be automated such that executives and directors, or even other users, can pull the data at the click of a button, without having to log into RE and develop queries and exports.  Heck, once it is in Excel, these reports can be posted onto SharePoint and rich reports displayed on web pages in SharePoint.

Update - Go check out this Microsoft Add-In which reports on The Raiser's Edge recurring gifts that I have created to show you how you can leverage Microsoft Excel a bit better.

Microsoft Access

Another application in the Microsoft Office suite of products is Microsoft Access. Data can be imported or linked through Access and then presented in a way that can be reported on.  Queries can be written, views created, forms generated, and data can even be taken offline for times when disconnection to The Raiser's Edge ensues.  When using Access, one must be careful to not update data directly in the SQL Server backend as the database could be corrupted with "bad data" that does not adhere to The Raiser's Edge front-end application. 

SQL Server Reporting Services (SSRS)

With SQL Server Reporting Services, you can create interactive, tabular, graphical, or free-form reports from relational, multidimensional, or XML-based data sources. Reports can include rich data visualization, including charts, and maps. You can publish reports, schedule report processing, or access reports on-demand. You can select from a variety of viewing formats, export reports to other applications such as Microsoft Excel, and subscribe to published reports. The reports that you create can be viewed over a Web-based connection or as part of a Microsoft Windows application or SharePoint site. You can also create data alerts on reports published to a SharePoint site and receive email messages when report data changes.


SharePoint Web Parts

SharePoint may be a tool that many of you are already using.  It is a great way to organize content such as documents and list-type information as well as enable knowledge sharing and collaboration.  However, when one views it truly as a knowledge sharing tool, letting it provide dashboards and reports to those users that don't need access to The Raiser's Edge application, but rely on reports generated from it can be opportunity.  Web pages can be created with custom web parts, or data view web parts, that pull information from The Raiser's Edge via SQL and display these reports and dashboards within the pages themselves.  This even allows for information sharing across geographic locations, or for those people that may travel, since the content is served up via web pages.drill-down.  SharePoint presents a great opportunity to share your Raiser's Edge data.

Check out my post on displaying a webpart in SharePoint reporting on Raiser's Edge data as an example.


Custom Application Development

Having a software developer create a dashboard application, or an application that contains dashboards, is a great way to have your Raiser's Edge data tell you a story.  A Dashboard application must serve another purpose as well to be worth the investment.  Maybe these reports need to come alive and offer drill-down capabilities, such as our Raiser's Edge Financial Dashboard.  Or maybe they have some further integration capabilities with the Raiser's Edge.  Even a Raiser's Edge plug-in could be created that is available from within The Raiser's Edge itself that provides additional reporting and dashboarding capabilities.  Whatever the extra requirements you have, custom application development can go a long way.

There are many other Business Intelligence (BI) and Analytics tools out there, such as Tableau, Spotfire and Logi, that can access a SQL Server database (which most Raiser's Edge customers use).  What I have presented to you is just a snippet of opportunities that many of you may already have in-house.  If you are hosted by Blackbaud then your options are severely limited.  There are other options out there should you want to explore those to allow you to improve your investment in The Raiser's Edge.  Should you want to explore one of these options or see what may be best for your organization to get more out of your Raiser's Edge investment you can go to our website for Tucamino Solutions and contact us via our website.

Thursday, June 20, 2013

Some Interesting Possibilities Displaying Raiser's Edge Reports and Dashboards in SharePoint

So you have invested in Microsoft SharePoint and you are trying to figure out how you can get the most bang for your buck.  Your organization also has purchased and implemented The Raiser's Edge.  You may be feeling that the reports in The Raiser's Edge are lacking, or that you don't have enough licenses to allow everyone in your organization to connect to The Raiser's Edge at the same time.  Perhaps you don't want to have to train all your end-users, especially those that only need reports anyway, on how to use The Raiser's Edge.

Well, you can leverage the SharePoint platform to display information from The Raiser's Edge via web pages.  It could be dashboards and other reports, lists of data, or even detailed information about your constituents, events, or other records in RE.  Imagine if you have users that need only read-only access: being able to have a web page in SharePoint where the user can enter filter or search criteria and view those constituents that meet the criteria along with details about those constituents, all without having to log into The Raiser's Edge.

Below are some of the ways that SharePoint can be leveraged to display this RE information, or any other information from any SQL database or other data sources:

ASP.NET Web Parts
Many ASP.NET web parts, such as the Grid View and Data List, available with SharePoint Designer, allow us to query and display data from different data sources in many types of formats, typically in a table or form layout. They can work with any data source that’s available in SharePoint Designer, like SQL Server, XML files, and more.  And with The Raiser's Edge being SQL-Server based, these web parts can be used to display this data. Another advantage is that it is easy to customize and considered "out-of-the-box"  and a "no-code" solution.  Check out this blog post where I use an ASP.NET to show a recent gift list from The Raiser's Edge.

Business Connectivity Services
The Business Connectivity Services allows SharePoint to connect to other systems, such as The Raiser's Edge, you already have, and work with them in various ways. A developer can configure the data connections to connect to The Raiser's Edge and import data into external content types, which can then be viewed in a SharePoint list.  What is great is this capability is native to SharePoint 2010 and 2013, however it can be a bit awkward at times, depending on what you might want to do.  In addition, it is meant to allow for data interaction (adding, editing, etc.) and not only for the consumption of data.  With The Raiser's Edge being a complex relational database model, it is advised that this feature not be utilized to update Raiser's Edge data, but to only view data.  Our first entry to show how BCS might be used is posted at the following link.

Excel Services
Excel Services provides the capability to display a named item from a Microsoft Excel workbook, such as a named range or chart, as a web part in a SharePoint web page.  This allows end users to build reports in Microsoft Excel and with developer assistance, display these for others to view as components in a web page.  A developer could even automate the creation of the Excel reports, the publication of the Excel workbook to SharePoint, and WHAM, all the reports are automagically updated.

SQL Server Reporting Services
SQL Server Reporting Services provides a full range of ready-to-use tools and services to help you create, deploy, and manage reports for your organization, as well as programming features that enable you to extend and customize your reporting functionality.  With Reporting Services, you can create interactive, tabular, graphical, or free-form reports from relational, multidimensional, or XML-based data sources. Reports can include rich data visualization, including charts, maps, and sparklines. You can publish reports, schedule report processing, or access reports on-demand. You can select from a variety of viewing formats, export reports to other applications such as Microsoft Excel, and subscribe to published reports. The reports that you create can be viewed over a Web-based connection or as part of a Microsoft Windows application or SharePoint site. You can also create data alerts on reports published to a SharePoint site and receive email messages when report data changes.

Visual Studio Custom Web Part
Visual Studio can be a powerful medium for creating components that can hook into SharePoint or The Raiser's Edge.  A custom web part that gives the developer more control over the visual presentation can be created with this development platform.  For example, a developer could create a visual web part that displays a chart based on some data from The Raiser's Edge.  This chart could be created by hooking into Google Charts to render the visual presentation of the chart.  I hope to create an example of this to show the power.  Parameters and Properties could be added to the web part to give further implemention options.  For examnple, one web part could allow the person deploying the web part on one page to display a pie chart for each Campaign, but on another the same web part could display the chart per Fund.  All in all, this is the most customizable option to creating that perfect set of web parts.

There are more options but these are a few of the highlights of possible ways to deploy Raiser's Edge reports and dashboards to SharePoint.  I hope to post an example for each of these in the coming months to give you detailed examples.  This type of reporting can be used for many other databases as well.  Contact us via email or go to our website to let us know how we can help you improve the way you work with The Raiser's Edge or Sharepoint.